All courses
Agentic AI
Agentic AI

IIIT Bangalore
Executive Programme in Generative AI for LeadersArtificial Intelligence
Degree / Exec. PG

IIIT Bangalore
Executive Diploma in Machine Learning and AI
OPJ Global University
Master’s Degree in Artificial Intelligence and Data Science
Liverpool John Moores University
Master of Science in Machine Learning & AI
Golden Gate University
DBA in Emerging Technologies with Concentration in Generative AIExecutive Certificate

IIITB & IIM, Udaipur
Chief Technology Officer & AI Leadership ProgrammeIIIT Bangalore
Executive Programme in Generative AI for Leaders
upGrad | Microsoft
Gen AI Foundations Certificate Program from MicrosoftupGrad | Microsoft
Gen AI Mastery Certificate for Data AnalysisupGrad | Microsoft
Gen AI Mastery Certificate for Software DevelopmentupGrad | Microsoft
Gen AI Mastery Certificate for Managerial ExcellenceOffline Bootcamps

upGrad
Data Science and AI-MLDoctorate
For All Domains
IIITB & IIM, Udaipur
Chief Technology Officer & AI Leadership Programme
Swiss School of Business and Management
Global Doctor of Business Administration from SSBM
Edgewood University
Doctorate in Business Administration by Edgewood UniversityGolden Gate University
Doctor of Business Administration From Golden Gate University
Rushford Business School
Doctor of Business Administration from Rushford Business School, SwitzerlandGolden Gate University
Master + Doctor of Business Administration (MBA+DBA)-d9bdeff6165f4eb1ba2adcebde78e961.svg)
University of Waterloo
Chief Technology and AI Officer ProgramLeadership / AI
Golden Gate University
DBA in Emerging Technologies with Concentration in Generative AIMachine Learning
Machine Learning
Data Science
Degree / Exec. PG
O.P Jindal Global University
Master’s Degree in Artificial Intelligence and Data ScienceIIIT Bangalore
Executive Diploma in Data Science & AILiverpool John Moores University
Master of Science in Data ScienceExecutive Certificate
upGrad | Microsoft
Gen AI Foundations Certificate Program from MicrosoftupGrad | Microsoft
Gen AI Mastery Certificate for Data AnalysisupGrad | Microsoft
Gen AI Mastery Certificate for Software DevelopmentupGrad | Microsoft
Gen AI Mastery Certificate for Managerial ExcellenceupGrad | Microsoft
Gen AI Mastery Certificate for Content CreationOffline Bootcamps
upGrad
Data Science and AI-MLupGrad
Data AnalyticsMBA
Masters

Paris School of Business
Master of Science in Business Management and TechnologyO.P.Jindal Global University
MBA (with Career Acceleration Program by upGrad)Edgewood University
MBA from Edgewood UniversityO.P.Jindal Global University
MBA from O.P.Jindal Global UniversityGolden Gate University
Master + Doctor of Business Administration (MBA+DBA)Executive Certificate

IMT, Ghaziabad
Advanced General Management ProgramMarketing
Executive Certificate
Offline Bootcamps
upGrad
Digital MarketingManagement
Degree
O.P Jindal Global University
MSc in International Accounting & Finance (ACCA integrated)Paris School of Business
Master of Science in Business Management and Technology
Golden Gate University
Master of Arts in Industrial-Organizational PsychologyExecutive Certificate

IIIT-B & IIM, Udaipur
Chief Technology Officer & AI Leadership Programme
IIM Kozhikode
Human Resource Analytics Course from IIM-KupGrad | Microsoft
Gen AI Foundations Certificate Program from MicrosoftEducation
Education

Northeastern University
Master of Education (M.Ed.) from Northeastern UniversityEdgewood University
Doctor of Education (Ed.D.)Edgewood University
Master of Education (M.Ed.) from Edgewood UniversityCertifications
Project Management
Certification

Knowledgehut
Leadership And Communications In ProjectsKnowledgehut
Microsoft Project 2007/2010-ae8d039bbd2a41318308f8d26b52ac8f.svg)
Knowledgehut
Financial Management For Project ManagersKnowledgehut
Fundamentals of Earned Value Management (EVM)Knowledgehut
Fundamentals of Portfolio ManagementKnowledgehut
Fundamentals of Program Management-35c169da468a4cc481c6a8505a74826d.webp&w=128&q=75)
Knowledgehut
CAPM® CertificationsKnowledgehut
Microsoft® Project 2016Certifications & Trainings
-7f4b4f34e09d42bfa73b58f4a230cffa.webp&w=128&q=75)
Knowledgehut
PMP® CertificationKnowledgehut
PMI-RMP® CertificationKnowledgehut
PMP Renewal Learning PathKnowledgehut
Oracle Primavera P6 V18.8Knowledgehut
Microsoft® Project 2013Knowledgehut
PfMP® Certification CourseKnowledgehut
Project Planning and MonitoringPrince2 Certifications

Knowledgehut
PRINCE2® FoundationKnowledgehut
PRINCE2® PractitionerKnowledgehut
PRINCE2 Agile Foundation and PractitionerKnowledgehut
PRINCE2 Agile® Foundation CertificationKnowledgehut
PRINCE2 Agile® Practitioner CertificationManagement Certifications
Knowledgehut
Project Management Masters Certification ProgramKnowledgehut
Change ManagementKnowledgehut
Project Management TechniquesKnowledgehut
Product Management Certification ProgramKnowledgehut
Project Risk Management- Study abroad
- Offline centres
- uGSOT - B.Tech
More


49. Variance in ML
Isolation Forest Algorithm for Anomaly Detection
In the expansive domain of data science, the ability to identify anomalies—observations that deviate significantly from the norm—is crucial for various applications. This holds true from fraud detection in finance to fault detection in manufacturing systems. In the isolation forest anomaly detection process, anomaly detection is a critical tool that helps uncover rare events that may indicate significant, issues or opportunities. Among the diverse techniques available for this purpose, the isolation forest algorithm has is a particularly effective method. This approach is efficient, accurate and is useful to handle large, complex datasets.
Overview
The isolation forest algorithm, is an ensemble method that focuses on isolating anomalies rather than modeling the normal points’ distribution. This approach chooses a feature at random and splits the value between the maximum and minimum values of the chosen feature, in contrast to conventional methods that use density or distance measurements to find outliers. This random partitioning produces noticeably shorter paths in trees for anomalies, which makes them easier to isolate.This guide aims to examine the mechanics of the isolation forest algorithm, exploring its unique approach to anomaly detection. We will look at its diverse applications, understand how to implement this technique in Python, discuss challenges, and understand the future of anomaly detection using this method.
Isolation Forest Anomaly Detection Mechanism
An unsupervised machine learning technique known as isolation forest is used to find abnormalities. It operates as an ensemble method, akin to a random forest. This means it aggregates the results of multiple decision trees to ascertain the anomaly score for each data point. Distinct from typical anomaly detection algorithms that first establish what constitutes "normal" data, this method focuses on isolating anomalies from the start.
Algorithm
Consider the following set of data points:

The isolation forest algorithm randomly chooses a dimension. In this example, it is an x-axis dimension. It then proceeds to randomly split the data along that chosen dimension.

The split created by the isolation forest algorithm results in two subspaces. Each forms a subtree. In this case, the split isolates a single data point on one side of the dataset, while the rest of the data points form a subtree. This leads to the initial binary tree having two nodes: the left represents the cluster of points, and the right represents the isolated point.
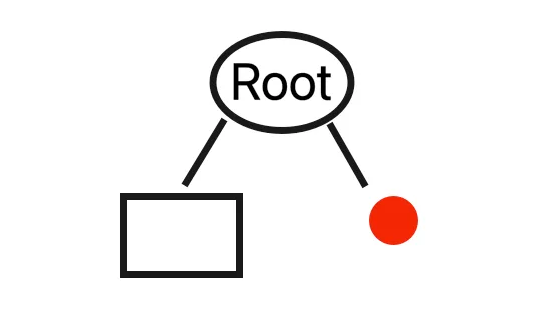
Please note that different trees in the ensemble use various initial splits. For instance, in the example provided above, the first split does not succeed in isolating the outlier.

This results in a tree with two nodes: one node holds the points on the left side of the split, and the other node represents the points on the right side of the split.
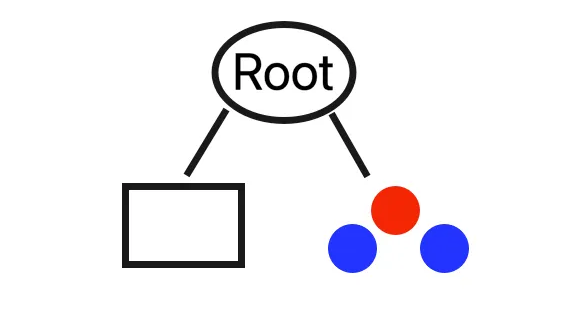
This continues, splitting the dataset until each leaf of the tree corresponds to a single data point. In this case, by the second round, the algorithm successfully isolates the outlier.

Following this step, the structure of the tree can be visualized as follows:
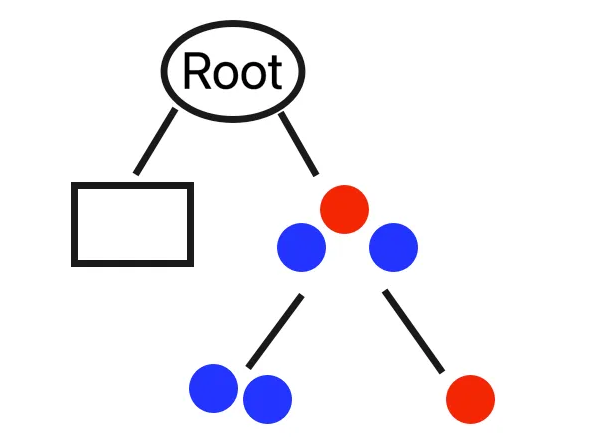
Note that splits can be made along other dimensions, as demonstrated by the third decision tree in this example.

Typically, an anomalous data point will be isolated at a shallower depth in the tree compared to normal points, owing to distinct characteristics. In the use of a trained isolation forest model, the final anomaly score for a data point is derived from averaging the scores from each decision tree in the ensemble.
Categorical Variables
If you are curious about handling categorical variables with the isolation forest algorithm, know that it considers fewer common values as potentially anomalous. It represents each categorical value as a rectangle, where the rectangle's size corresponds to the frequency of that value's occurrence. This visual representation helps the algorithm to effectively split and isolate less frequent, and thus potentially anomalous, categories.

We assess the range of possible values from the midpoint of the first to the midpoint of the last value. We then randomly select a point within this range to identify the nearest edge of the corresponding rectangle. This edge is used for the split.
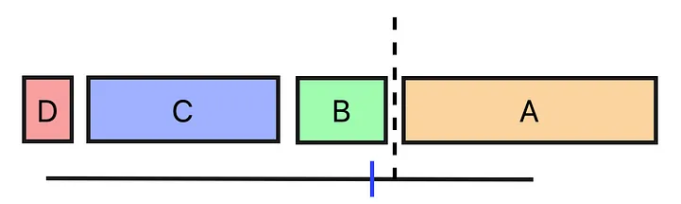
To ensure fairness, each tree in the forest adopts a different sequence for processing the splits.

Python
Here is an example of how to implement the isolation forest algorithm in Python.
Begin by importing the necessary libraries:
from sklearn.ensemble import IsolationForest
from sklearn.datasets import load_breast_cancer
from sklearn.model_selection import train_test_split
from sklearn.metrics import confusion_matrix
from sklearn.utils import resample
import pandas as pd
In the following isolation forest anomaly detection Python tutorial, we will explore the breast cancer dataset provided by the UCI machine learning repository. the 'scikit-learn' library offers a convenient function to easily download this dataset.
breast_cancer = load_breast_cancer()
df = pd.DataFrame(data=breast_cancer.data,
columns=breast_cancer.feature_names)
df["benign"] = breast_cancer.target
The dataset includes 30 numerical features, along with a target variable that assigns the values 0 and 1 to benign and malignant tumors, respectively.
df.head()
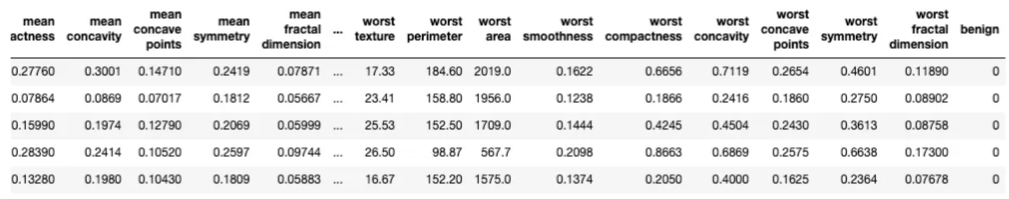
In this case, we will consider a malignant tumor as an anomaly. The dataset has a notably high incidence of malignant tumors, prompting us to down sample, to balance the data.
majority_df = df[df["benign"] == 1]
minority_df = df[df["benign"] == 0]
minority_downsampled_df = resample(minority_df, replace=True, n_samples=30, random_state=42)
downsampled_df = pd.concat([majority_df, minority_downsampled_df])
Now there are over 10x more samples of the majority class than the minority class.
downsampled_df["benign"].value_counts()
1 357
0 30Name: benign, dtype: int64
We store the features and target values as distinct variables.
y = downsampled_df["benign"]
X = downsampled_df.drop("benign", axis=1)
We allocate a portion of the entire dataset for testing purposes.
X_train, X_test, y_train, y_test = train_test_split(X, y, random_state=42)
Then, we instantiate an object of the 'IsolationForest' class.
model = IsolationForest(random_state=42)
We proceed to train the model.
model.fit(X_train, y_train)
We make predictions on the data in the test set.
y_pred = model.predict(X_test)
The 'IsolationForest' assigns a value of -1 rather than 0. Consequently, we replace it to ensure our confusion matrix contains only two distinct values.
y_pred[y_pred == -1] = 0
As observed, the algorithm effectively identifies anomalous data points.
confusion_matrix(y_test, y_pred)
array([[ 7, 2],
[ 5, 83]])
Hyperparameter Tuning for Isolation Forest Algorithm
The aim of the isolation forest algorithm hyperparameter tuning process is to maximize the model's performance for anomaly detection jobs.
Key hyperparameters include the number of trees (n_estimators), the maximum number of samples (max_samples), and the contamination level. Here's a deeper look into these parameters and how to effectively tune them using techniques like grid search and randomized search.
1. Number of Trees (n_estimators):
- Purpose: Increases the number of trees to improve the model’s accuracy. More trees provide a better approximation of the anomaly score.
- Tuning: Generally, a higher number of trees can lead to better performance but at the cost of increased computational load and memory usage. Grid search or randomized search is used to find a balance between performance and efficiency. Typical ranges might be from 100 to 500 trees.
2. Maximum Samples (max_samples):
- Purpose: Defines the number of samples to draw from the entire dataset to build each tree. It impacts both the diversity of the trees and the detection limits.
- Tuning: The value can either be an integer or a float (representing a percentage of the total dataset). Smaller max_samples sizes may increase training speed but could affect detection performance, especially in diverse datasets. Testing different ratios via randomized search can efficiently identify a suitable percentage.
3. Contamination Level:
- Purpose: The expected proportion of outliers in the dataset. This parameter directly affects the threshold used to decide whether a data point is an outlier.
- Tuning: Setting this parameter correctly impacts the model's sensitivity to outliers. A grid search over a range of expected contamination values (like 0.01, 0.05, 0.1) helps calibrate the model more precisely to the specific dataset.
Techniques for Hyperparameter Tuning:
Below are some techniques used for hyperparameter tuning:
1. Grid Search:
- Approach: Exhaustively tests possible combinations of predefined values for each parameter.
- Usage: Computational resources where the range of possible values isn’t excessively large.
2. Randomized Search:
- Approach: Samples parameter settings from given distributions. More efficient than grid search as not all parameter combinations are tried.
- Usage: Dealing with large hyperparameter spaces that require a fast and effective method.
3. Impact on Performance:
- Accuracy: Proper tuning significantly improves the accuracy of anomaly detection. Setting max_samples too low might miss nuances in larger datasets, while too high a value might make the trees too similar and reduce the effectiveness of the ensemble.
- Computational Efficiency: Optimizing n_estimators and max_samples helps manage computational load, making the model faster without compromising on detection capabilities.
Effective hyperparameter tuning of the isolation forest algorithm helps enhance performance in anomaly detection tasks. Using systematic approaches like grid search and randomized search helps explore the hyperparameter space methodically. This helps to find optimal settings tailored to specific needs and data characteristics, improves accuracy and computational efficiency of the model.
Final Words
The concepts of isolation forest anomaly detection offer a promising approach to identify outliers across datasets. The ability of anomaly detection using isolation forest helps handle high-dimensional data efficiently, offers robustness to outliers, and allows ease of implementation. This is what makes it a valuable tool.
It is also essential to acknowledge the limitations of this concept. This includes performance on dense data and the need for careful parameter tuning. Despite these challenges, isolation forest is a popular choice as it offers scalability.
Finally, understanding the strengths and weaknesses of this concept enables practitioners to leverage it effectively in anomaly detection tasks, contributing to reliable and accurate outlier detection in real-world scenarios.
Frequently Asked Questions
1. How does Isolation Forest work for anomaly detection?
Isolation Forest randomly partitions data points into isolation trees. Anomalies are isolated faster because they require fewer partitions to separate them from the majority of normal instances. This approach exploits the intuition that anomalies are typically few and far from the norm, making them easier to separate.
2. What are the three basic approaches to anomaly detection?
The three fundamental methods for detecting anomalies are: Supervised Learning: Involves training a model on labeled data, where anomalies are explicitly identified.Unsupervised Learning: Involves detecting anomalies without labeled data and relying on detecting deviations from the norm within the dataset.Semi-Supervised Learning: Involves detecting anomalies using a combination of labeled and unlabeled data. This approach leverages both labeled anomalies and unlabeled data to identify deviations from normal behavior. Supervised Learning: Involves training a model on labeled data, where anomalies are explicitly identified. Supervised Learning : Involves training a model on labeled data, where anomalies are explicitly identified. Unsupervised Learning: Involves detecting anomalies without labeled data and relying on detecting deviations from the norm within the dataset. Unsupervised Learning : Involves detecting anomalies without labeled data and relying on detecting deviations from the norm within the dataset. Semi-Supervised Learning: Involves detecting anomalies using a combination of labeled and unlabeled data. This approach leverages both labeled anomalies and unlabeled data to identify deviations from normal behavior. Semi-Supervised Learning : Involves detecting anomalies using a combination of labeled and unlabeled data. This approach leverages both labeled anomalies and unlabeled data to identify deviations from normal behavior.
3. What is the Isolation Forest classification model?
The isolation forest classification model is a tree-based ensemble algorithm used for anomaly detection. It isolates anomalies by randomly partitioning data points into isolation trees, making anomalies easier to separate from the majority of normal instances.
4. What is the idea of Isolation Forest?
The idea of isolation forest is to isolate anomalies by randomly partitioning data points into isolation trees, exploiting the fact that anomalies are typically fewer in number and are located further from the majority of normal instances.
5. Why is Isolation Forest good?
This algorithm is efficient as it helps detect anomalies in high-dimensional datasets. It is robust to outliers, and relatively easy to implement compared to other anomaly detection algorithms.
6. What is the objective function of Isolation Forest?
The objective function of an isolation forest algorithm is to isolate anomalies by minimizing the path length to reach them in the constructed isolation trees while ensuring normal instances are grouped more densely.

Author|416 articles published


upGrad Learner Support
Talk to our experts. We are available 7 days a week, 10 AM to 7 PM
Indian Nationals
Foreign Nationals
Disclaimer
The above statistics depend on various factors and individual results may vary. Past performance is no guarantee of future results.
The student assumes full responsibility for all expenses associated with visas, travel, & related costs. upGrad does not .