All courses
Agentic AI
Agentic AI

IIIT Bangalore
Executive Programme in Generative AI for LeadersArtificial Intelligence
Degree / Exec. PG

IIIT Bangalore
Executive Diploma in Machine Learning and AI
OPJ Global University
Master’s Degree in Artificial Intelligence and Data Science
Liverpool John Moores University
Master of Science in Machine Learning & AI
Golden Gate University
DBA in Emerging Technologies with Concentration in Generative AIExecutive Certificate

IIITB & IIM, Udaipur
Chief Technology Officer & AI Leadership ProgrammeIIIT Bangalore
Executive Programme in Generative AI for Leaders
upGrad | Microsoft
Gen AI Foundations Certificate Program from MicrosoftupGrad | Microsoft
Gen AI Mastery Certificate for Data AnalysisupGrad | Microsoft
Gen AI Mastery Certificate for Software DevelopmentupGrad | Microsoft
Gen AI Mastery Certificate for Managerial ExcellenceOffline Bootcamps

upGrad
Data Science and AI-MLDoctorate
For All Domains
IIITB & IIM, Udaipur
Chief Technology Officer & AI Leadership Programme
Swiss School of Business and Management
Global Doctor of Business Administration from SSBM
Edgewood University
Doctorate in Business Administration by Edgewood UniversityGolden Gate University
Doctor of Business Administration From Golden Gate University
Rushford Business School
Doctor of Business Administration from Rushford Business School, SwitzerlandGolden Gate University
Master + Doctor of Business Administration (MBA+DBA)-d9bdeff6165f4eb1ba2adcebde78e961.svg)
University of Waterloo
Chief Technology and AI Officer ProgramLeadership / AI
Golden Gate University
DBA in Emerging Technologies with Concentration in Generative AIMachine Learning
Machine Learning
Data Science
Degree / Exec. PG
O.P Jindal Global University
Master’s Degree in Artificial Intelligence and Data ScienceIIIT Bangalore
Executive Diploma in Data Science & AILiverpool John Moores University
Master of Science in Data ScienceExecutive Certificate
upGrad | Microsoft
Gen AI Foundations Certificate Program from MicrosoftupGrad | Microsoft
Gen AI Mastery Certificate for Data AnalysisupGrad | Microsoft
Gen AI Mastery Certificate for Software DevelopmentupGrad | Microsoft
Gen AI Mastery Certificate for Managerial ExcellenceupGrad | Microsoft
Gen AI Mastery Certificate for Content CreationOffline Bootcamps
upGrad
Data Science and AI-MLupGrad
Data AnalyticsMBA
Masters

Paris School of Business
Master of Science in Business Management and TechnologyO.P.Jindal Global University
MBA (with Career Acceleration Program by upGrad)Edgewood University
MBA from Edgewood UniversityO.P.Jindal Global University
MBA from O.P.Jindal Global UniversityGolden Gate University
Master + Doctor of Business Administration (MBA+DBA)Executive Certificate

IMT, Ghaziabad
Advanced General Management ProgramMarketing
Executive Certificate
Offline Bootcamps
upGrad
Digital MarketingManagement
Degree
O.P Jindal Global University
MSc in International Accounting & Finance (ACCA integrated)Paris School of Business
Master of Science in Business Management and Technology
Golden Gate University
Master of Arts in Industrial-Organizational PsychologyExecutive Certificate

IIIT-B & IIM, Udaipur
Chief Technology Officer & AI Leadership Programme
IIM Kozhikode
Human Resource Analytics Course from IIM-KupGrad | Microsoft
Gen AI Foundations Certificate Program from MicrosoftEducation
Education

Northeastern University
Master of Education (M.Ed.) from Northeastern UniversityEdgewood University
Doctor of Education (Ed.D.)Edgewood University
Master of Education (M.Ed.) from Edgewood UniversityCertifications
Project Management
Certification

Knowledgehut
Leadership And Communications In ProjectsKnowledgehut
Microsoft Project 2007/2010-ae8d039bbd2a41318308f8d26b52ac8f.svg)
Knowledgehut
Financial Management For Project ManagersKnowledgehut
Fundamentals of Earned Value Management (EVM)Knowledgehut
Fundamentals of Portfolio ManagementKnowledgehut
Fundamentals of Program Management-35c169da468a4cc481c6a8505a74826d.webp&w=128&q=75)
Knowledgehut
CAPM® CertificationsKnowledgehut
Microsoft® Project 2016Certifications & Trainings
-7f4b4f34e09d42bfa73b58f4a230cffa.webp&w=128&q=75)
Knowledgehut
PMP® CertificationKnowledgehut
PMI-RMP® CertificationKnowledgehut
PMP Renewal Learning PathKnowledgehut
Oracle Primavera P6 V18.8Knowledgehut
Microsoft® Project 2013Knowledgehut
PfMP® Certification CourseKnowledgehut
Project Planning and MonitoringPrince2 Certifications

Knowledgehut
PRINCE2® FoundationKnowledgehut
PRINCE2® PractitionerKnowledgehut
PRINCE2 Agile Foundation and PractitionerKnowledgehut
PRINCE2 Agile® Foundation CertificationKnowledgehut
PRINCE2 Agile® Practitioner CertificationManagement Certifications
Knowledgehut
Project Management Masters Certification ProgramKnowledgehut
Change ManagementKnowledgehut
Project Management TechniquesKnowledgehut
Product Management Certification ProgramKnowledgehut
Project Risk Management- Study abroad
- Offline centres
- uGSOT - B.Tech
More


49. Variance in ML
Mahalanobis Distance: Formula, Code and Examples
Statisticians use Mahalanobis distance as an indicator in mathematical statistics to quantify the distance between two points in a multidimensional space. Different from Euclidean distance, which is the straight-line distance between any two points, Mahalanobis distance is developed to represent the correlations between variables and the variability of each variable. In technical terms, it carries out two tasks simultaneously: first, determining the extent of data scattering and second, identifying the connections between different variables.
Importance in Statistical Analysis
Mahalanobis distance is significant as it is a tool of statistical analysis used in comparing observations of data among other things, considering the structure and correlations present statistically. The inclusion of covariance structure in Mahalanobis distance aids in the processes of outlier detection, anomaly detection, and pattern understanding that may not be possible otherwise using Euclidean distance or other traditional distance measures.
Applications in Various Fields
Various applications use Mahalanobis distance. Below are some of them.
- Machine Learning and Data Mining: Mahalanobis distance is considered an essential element of machine learning algorithms, especially where they are used in clustering strategies such as k-means clustering and where it helps in classification algorithms like support vector machines (SVM).
- Quality Control and Anomaly Detection: Fields like production and cash work with Mahalanobis distance for some particular purposes, such as quality handling and anomaly detection. It provides for comparison between the reference distribution and an unusual or defective observation in the dataset according to the original data normals.
- Biometrics and Pattern Recognition: Biometric systems use Mahalanobis distance to recognize individuals based on their physiology or behavioral patterns. This process is used to match biometric data with corresponding reference templates, taking into account the inevitable variations in biological features.
Mahalanobis Distance Formula
The distance between a point and a distribution can be calculated using the efficient multivariate distance metric known as the Mahalanobis distance. Below, we explain in detail the mathematical expression, components of the formula, and interpretation of the results.
Mathematical Expression
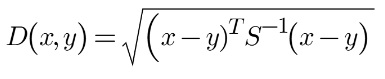
Where:
x and y are p compact column vectors showing two points.
𝑆 corresponds to the covariance matrix of the data.
This measure is the difference of 𝑥x and 𝑦y, normalized by the covariance matrix 𝑆S. The system will provide the resultant distance measure by computing the square root of the ensuing scalar operation.
Components of the Formula
The difference between points, covariance matrix, and square root are components of the formula. These are explained in detail.
- Difference between Points (𝑥−𝑦x−y): That means the resulting vector will be considered a subtraction between the given 𝑝p-dimensional spaces. It points out the displacement of quantity (x) on the x-axis relative to the opposite quantity (y) along the y-axis.
- Covariance Matrix (𝑆S): The covariance matrix is a vector that aggregates the information of the relations between variables. It is a symmetrical and 𝑝×𝑝p×p matrix that represents the covariance between two variables. Each element does this. Contrary to this, the inverse of 𝑆−1𝑆−1 makes use of this matrix to make the distance calculations keep in mind correlations and scale units.
- Square Root: From this scaling, the resulting scalar is then taken into account, and the positive Mahalanobis distance is attributed to the position of the points in space.
Interpretation of the Result
The Mahalanobis distance gives an estimate of dissimilarity between two objects in a dataset when complied with the correlations and weights of the variables' scales. Here's how to interpret the result:
- Small Distance: A much lower case of Mahalanobis distance, thus, shows that points x and y tend to be closer to each other in the multidimensional space, often resulting in a similarity or correlation between them.
- Large Distance: The inhabitants of the capital are expected to see a major increase in the prices of their homes as well as a decline in the availability of housing units.
Practical Applications of Mahalanobis Distance Matrix
The Mahalanobis distance matrix is the name of a square matrix that comprises the Mahalanobis distance between any pair of points or data samples. Such a metric aims to calculate the overall magnitude of divergence between observations while paying attention to the scales and correlations between the variables.
- Clustering Analysis: The Mahalanobis distance matrix can be used to calculate distance values between objects, which are later used by clustering algorithms to group similar observations. It helps drill the clusters associated with the distance between observations. It also factored in the dependencies, such as the presence of covariance structures inherent to data.
- Anomaly Detection: The Mahalanobis distance matrix is employed in cases of anomaly detection to pinpoint anomalous data or observations in datasets that do not conform to their structures. A value approaching Mahalanobis distance more than beyond a certain boundary is set by the algorithm as historical, which signifies deviations from the normal behavior of the information.
- Quality Control: In manufacturing and quality applications, the Mahalanobis distance matrix is essentially employed to scrutinize product quality and alarm defects. Abnormalities, interpretable as when the observed outcomes do not follow the expected trends as indicated by the Mahalanobis distance matrix could be related to abnormalities in the production process.
Mahalanobis Distance in Python
Mahalanobis distance can be realized in Python through several libraries. These libraries have functions that provide Mahalanobis distance calculation efficiency, which will lead to convenient use in data analysis and machine learning.
Below, you can find libraries that calculate Mahalanobis distance, such as NumPy and SciPy.
NumPy:
- NumPy is sort of a main library for scientific computing with Python.
- It offers the numpy. cov() function to get the covariance matrix necessary for the Maheanobis distance estimation.
- Additionally, distances are computed with an array machine's function for speedy calculations.
SciPy:
- SciPy in fact, is the library for scientific computing and technical tasks which is based on NumPy.
- It includes the scipy. spatial. distance. mahalanobis() method is used to be for the measurement of Mahalanobis distance.
- SciPy contains these as additional features: distance-related operations and statistical analysis.
Step-by-Step Python Code Example
Python
Import numpy as np
from scipy.spatial import distance
# Step 1: Define the data points
x = np.array([1, 2, 3])
y = np.array([4, 5, 6])
# Step 2: Compute the covariance matrix
cov_matrix = np.cov(x, y)
# Step 3: Calculate the Mahalanobis Distance
mahalanobis_dist = distance.mahalanobis(x, y, cov_matrix)
print("Mahalanobis Distance:", mahalanobis_dist)
Practical Mahalanobis Distance Examples
Example 1: Calculation of the Distance between Two Commands
- This is an example of calculating the Mahalanobis distance between two data points via Python.
- It presents the way these formulas are used in real-world applications.
Example 2: Mahalanobis Distance: Risk Detection in Anomaly
- This is the case where Mahalanobis distance is used to detect cases where the input is not an outlier or anomaly in the data set.
- Threshold values may be defined to distinguish those data points that differ most from the reference distribution by comparing the distances between the data and the distribution.
Factors Influencing Mahalanobis Distance
Mahalanobis distance is influenced by several factors that can affect its accuracy and interpretation:
- Covariance Structure: In the case of Mahalanobis distance, the covariance matrix (Ŝ) appears in a very important place. A shift regarding the covariance structure that includes, different variances of variables among others, can necessarily influence the distances measured.
- Number of Dimensions: Datapoint differences manifest on more than one parameter; therefore, this machinery is sensitive to the high dimensionality of the data. In this case, when the dimension of the space is high and the number of variables is larger than the number of observations, we tend to encounter some estimation issues that lead to distorted distance estimations.
- Data Distribution: The normal assumption of multivariate (Mahalanobis) distance may not work well for real-world datasets; therefore, it is necessary to look for some other alternative. Distortion of the norm can not only significantly hamper normal distance measurements but also necessitate special methods of data transformation before the actual calculations.
Limitations of the Mahalanobis Distance Metric
Despite its usefulness, Mahalanobis distance has certain limitations that should be considered:
- Sensitivity to Outliers: However, Mahalanobis distance is often affected by outliers, especially in cases where the covariance matrix crucial to accuracy in estimation is concerned. Outliers may play a crucial role in the calculation process. Thus, it means the distance measurements may be distorted and eventually rather erroneous conclusions could be drawn.
- Assumption of Multivariate Normality: Mahalanobis distance is based on the assumption of observations following a multivariate normal distribution. Other than that, if this hypothesis holds, then the distance function may not be able to ring the right chimes to reflect the real relationships.
- Curse of Dimensionality: In high-space dimensionalization, the curse of dimensionality problems might be present for Mahalanobis distance computation algorithms. For multiple dimensions, the number of observations that are essential in evaluating the matrix of covariance accurately grows exponentially, and thus, the overfitting or underestimation of the distances is prompted.
Best Practices for Effective Utilization
To mitigate the challenges and maximize the effectiveness of Mahalanobis distance, consider the following best practices:
- Data Preprocessing: Be sure to handle all missing data, give variables the scaling they need, and aid in spotting and squaring outliers.
- Covariance Estimation: By robust estimation approaches of covariance matrices, particularly under the condition of outliers or residual non-normal distribution functions. For instance, try shrinking estimation or covariance matrix estimation.
- Validation and Sensitivity Analysis: Verify Mahalanobis distance results erring on the side of caution with the help of cross-validation as well as sensitivity analysis.
Wrapping Up!
Mahalanobis distance is a strong statistical measure that is effective in the analysis of data and also in the fields of machine learning. Its implementation in Python using libraries like NumPy and SciPy is characterized by efficiency and also mind-blowing applications. By understanding its mechanisms, implications, and weaknesses, the practitioners will be able to use the rule in numerous real-world specific tasks to extract information from the data and make well-considered decisions.
FAQs
1. What is the difference between Euclidean and Mahalanobis distance?
Euclidean distance selects the shortest amount of direct distance between two points, while Mahalanobis distance makes calculations by considering relationships and scales of different variables when they are in multidimensional space.
2. What is Mahalanobis distance in multivariate analysis?
Mahalanobis distance is a measure used in multivariate analysis to determine the distance between a point and a distribution. It is particularly useful in identifying outliers and in cluster analysis.
3. What is Max Mahalanobis distance?
The maximum distance covered by Mahalanobis distance is between a point and the distribution, which is beneficial in the case of outlier detection.
4. What is vector Mahalanobis distance?
The vector Mahalanobis distance measures how far apart two vectors are, taking into consideration their covariance, and the amplitude (scale) of the vectors.
5. What is Mahalanobis distance used for?
Mahalanobis distance is effective in cluster analysis, anomaly detection, classification, and pattern recognition due to its ability to control the influence of correlated variables.
6. What is the Mahalanobis distance formula?
Where 𝑥 and 𝑦 are data points, and 𝑆 is the covariance matrix.

Author|416 articles published


upGrad Learner Support
Talk to our experts. We are available 7 days a week, 10 AM to 7 PM
Indian Nationals
Foreign Nationals
Disclaimer
The above statistics depend on various factors and individual results may vary. Past performance is no guarantee of future results.
The student assumes full responsibility for all expenses associated with visas, travel, & related costs. upGrad does not .