All courses
Agentic AI
Agentic AI
Artificial Intelligence
Degree / Exec. PG

IIIT Bangalore
Executive Diploma in Machine Learning and AI
OPJ Global University
Master’s Degree in Artificial Intelligence and Data Science
Liverpool John Moores University
Master of Science in Machine Learning & AI
Golden Gate University
DBA in Emerging Technologies with Concentration in Generative AIExecutive Certificate

IIITB & IIM, Udaipur
Chief Technology Officer & AI Leadership Programme
IIIT-B & IIM, Udaipur
Chief Data and AI Officer Programme
IIIT Bangalore
Executive Programme in Generative AI for Leaders
upGrad | Microsoft
Gen AI Mastery Certificate for Software DevelopmentOffline Bootcamps

upGrad
Data Science and AI-MLDoctorate
For All Domains
IIITB & IIM, Udaipur
Chief Technology Officer & AI Leadership Programme
Swiss School of Business and Management
Global Doctor of Business Administration from SSBM
Edgewood University
Doctorate in Business Administration by Edgewood UniversityGolden Gate University
Doctor of Business Administration From Golden Gate University
Rushford Business School
Doctor of Business Administration from Rushford Business School, Switzerland-d9bdeff6165f4eb1ba2adcebde78e961.svg)
University of Waterloo
Chief Technology and AI Officer ProgramLeadership / AI
Golden Gate University
DBA in Emerging Technologies with a concentration in Generative and Agentic AIMachine Learning
Machine Learning
Data Science
Degree / Exec. PG
O.P Jindal Global University
Master’s Degree in Artificial Intelligence and Data ScienceIIIT Bangalore
Executive Diploma in Data Science & AILiverpool John Moores University
Master of Science in Data ScienceExecutive Certificate
upGrad | Microsoft
Gen AI Foundations Certificate Program from MicrosoftIIIT-B & IIM, Udaipur
Chief Data and AI Officer ProgrammeupGrad | Microsoft
Gen AI Mastery Certificate for Data AnalysisupGrad | Microsoft
Gen AI Mastery Certificate for Software DevelopmentupGrad | Microsoft
Gen AI Mastery Certificate for Managerial ExcellenceupGrad | Microsoft
Gen AI Mastery Certificate for Content CreationOffline Bootcamps
upGrad
Data Science and AI-MLMBA
Masters

Liverpool John Moores University
Master of Business Administration from Liverpool John Moores University (LJMU) with IIM Udaipur CertificationO.P.Jindal Global University
MBA (with Career Acceleration Program by upGrad)Edgewood University
MBA from Edgewood UniversityO.P.Jindal Global University
MBA from O.P.Jindal Global UniversityExecutive Certificate

IMT, Ghaziabad
Advanced General Management ProgramMarketing
Executive Certificate
upGrad | Microsoft
Gen AI Foundations Certificate Program from MicrosoftupGrad | Microsoft
Gen AI Mastery Certificate for Content CreationOffline Bootcamps
upGrad
Digital MarketingManagement
Degree
O.P Jindal Global University
MSc in International Accounting & Finance (ACCA integrated)
Golden Gate University
Master of Arts in Industrial-Organizational PsychologyExecutive Certificate
IIIT-B & IIM, Udaipur
Chief Technology Officer & AI Leadership ProgrammeIIIT-B & IIM, Udaipur
Chief Data and AI Officer Programme
IIM Kozhikode
Human Resource Analytics Course from IIM-KupGrad | Microsoft
Gen AI Foundations Certificate Program from MicrosoftEducation
Education

Northeastern University
Master of Education (M.Ed.) from Northeastern UniversityEdgewood University
Doctor of Education (Ed.D.)Edgewood University
Master of Education (M.Ed.) from Edgewood UniversityCertifications
Project Management
Certification

Knowledgehut
Leadership And Communications In ProjectsKnowledgehut
Microsoft Project 2007/2010-ae8d039bbd2a41318308f8d26b52ac8f.svg)
Knowledgehut
Financial Management For Project ManagersKnowledgehut
Fundamentals of Earned Value Management (EVM)Knowledgehut
Fundamentals of Portfolio ManagementKnowledgehut
Fundamentals of Program Management-35c169da468a4cc481c6a8505a74826d.webp&w=128&q=75)
Knowledgehut
CAPM® CertificationsKnowledgehut
Microsoft® Project 2016Certifications & Trainings
-7f4b4f34e09d42bfa73b58f4a230cffa.webp&w=128&q=75)
Knowledgehut
PMP® CertificationKnowledgehut
PMI-RMP® CertificationKnowledgehut
PMP Renewal Learning PathKnowledgehut
Oracle Primavera P6 V18.8Knowledgehut
Microsoft® Project 2013Knowledgehut
PfMP® Certification CourseKnowledgehut
Project Planning and MonitoringPrince2 Certifications

Knowledgehut
PRINCE2® FoundationKnowledgehut
PRINCE2® PractitionerKnowledgehut
PRINCE2 Agile Foundation and PractitionerKnowledgehut
PRINCE2 Agile® Foundation CertificationKnowledgehut
PRINCE2 Agile® Practitioner CertificationManagement Certifications
Knowledgehut
Project Management Masters Certification ProgramKnowledgehut
Change ManagementKnowledgehut
Project Management TechniquesKnowledgehut
Product Management Certification ProgramKnowledgehut
Project Risk Management- Study abroad
- Offline centres
- uGSOT - B.Tech
More
%20(2)-db0b6f38da9c485faf76e366793c9b9e.webp&w=128&q=75)


27. Columns in Excel
33. Count In Excel
49. Slicers in Excel
54. Solver in Excel
56. Macros In Excel
Average Equation In Excel
It’s quite easy to forget the wide variety of functions and formulas available on Excel, given their varying degree of complexity. However, Average equation in Excel is one of those functions that you will probably end up using a lot.
I have used Excel for many years and the `AVERAGE` in Excel, is one of these important Excel Formulae. When you look at big sets of numbers, using the Average functions in Excel help make them easier to understand.
The Average function is more than just a basic arithmetic mean calculation tool. Using the Average function in Excel makes turning heaps of numbers into one easy-to-get number possible, a must-have for making big choices, especially when you might need to find out mean across variable distribution and chart it out.
This tutorial will help you to master using the Average function. It's all about making big data easier to handle and to make smart decisions based on that data.
AVERAGE Formula in Excel
The AVERAGE equation in Excel is a built-in function in Excel that is designed to calculate the arithmetic mean of a group of numbers. This is a really simple yet very powerful function available for statistical analysis in Excel.
Syntax =AVERAGE
When you use the AVERAGE calculation in Excel, it adds all the numbers in a specified range and divides the sum by the count of numeric entries in the range.
Example:
Consider the simple set of numbers: 2, 3, and 4. Here’s how the AVERAGE function works:
- Total number of observations: 3 (which are 2, 3, and 4)
- Sum of the observations: (2 + 3 + 4 = 9)
- Calculation of the average: (9 / 3 = 3)
So the average of the numbers 2, 3, and 4 that comes out is 3.
Note:
- The AVERAGE function only considers numerical entries in its calculations. It automatically ignores any cells that contain text.
Practical Example: Calculating the Average Number of Pokeballs per Trainer
Example scenario: Imagine a team of Pokémon trainers tracking their usage of Pokéballs. To find out the average number of Pokéballs used per trainer, utilize the AVERAGE function in Excel.

Steps to Use the =AVERAGE Formula in Excel:
- Select a Cell: Click on the cell where you want the result to appear (e.g., F2).
- Type the Function: Enter `=AVERAGE`.
- Activate the Function: Double-click the AVERAGE command from the formula suggestions.
- Select the Range: Choose the range of cells containing the data (e.g., B2:E2) which holds the number of Pokéballs each trainer used.
- Press Enter.
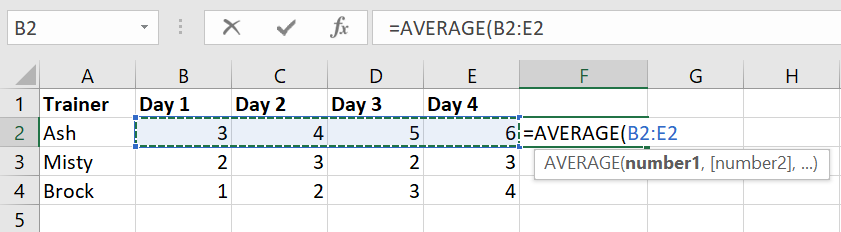
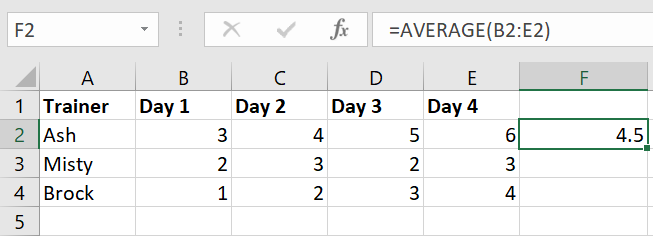
The cell you selected will now display the average number of Pokéballs used per trainer based on the data in the selected range.
Additional Example: Handling Cells with Text
Consider you have a range of cells where some contain numbers and others contain text. For example:
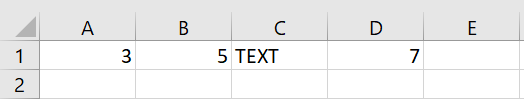
If you apply the AVERAGE function across this range (A1:D1), Excel will calculate the average of the numbers 3, 5, and 7, ignoring the "Text" entry.
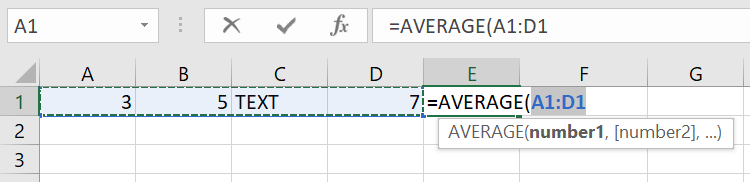
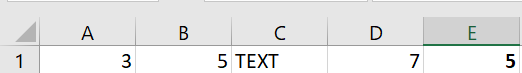
Result: (3 + 5 + 7) / 3 = 5
The calculated average is 5, as the text is excluded from the calculation.
This example illustrates how the AVERAGE formula in Excel simplifies data analysis in Excel by efficiently managing typical data variations and focusing only on numeric inputs. Whether you're calculating daily sales, average temperatures, or any other metric, the AVERAGE functions in Excel is a go-to tool for quick and accurate averages.
AVERAGEIF Function
The AVERAGEIF function in Excel is designed to calculate the average of numbers in a range that meets a specified criterion. This function is incredibly useful for analyzing subsets of data within a larger dataset.
Syntax:
=AVERAGEIF(range, criteria, [average_range])
- range: This is the range of cells that you evaluate with the criteria.
- criteria: This defines the condition that must be met. It can be a number, expression, or text that defines which cells will be included in the average.
- [average_range]: This is the range of cells from which the average is actually calculated. If omitted, Excel uses the "range" as the default.
Criteria Examples:
" > 10": Select cells greater than 10.
" < 20": Select cells less than 20.
" = Grass": Select cells equal to "Grass".
Note: The list separator (comma `,` or semicolon `;`) varies based on your Excel language settings.
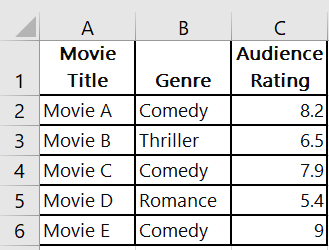
Practical Example: Calculating Average Ratings of 'Comedy' Movies
Imagine you have a dataset with movie genres and their audience ratings, and you want to find the average rating for all comedy movies.
Dataset Structure:
Steps to Use AVERAGEIF Function:
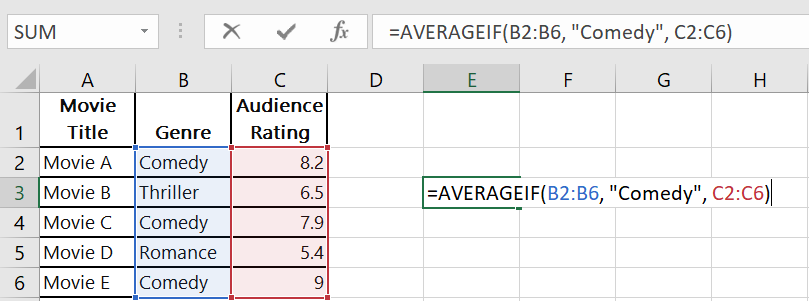
- Select the Output Cell: For instance, F3.
- Enter the Function: Type `=AVERAGEIF(B2:B6, "Comedy", C2:C6)`.
- Activate the Function: As you start typing, you may select the function from Excel's suggestions to ensure proper syntax.
- Define the Range and Criteria:
Range for Criteria: B2:B6 (Genres)
Criteria: "Comedy"
Range for Average: C2:C6 (Audience Ratings)
- Press Enter.
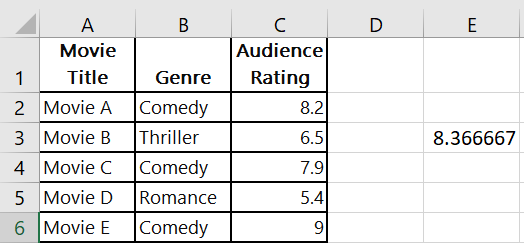
In cell F3, Excel will calculate the average rating for the movies classified as comedies. For our data, it calculates the average of 8.2, 7.9, and 9.0, resulting in approximately 8.37.
Using AVERAGEIF for Various Genres:
You can easily adapt the formula for different genres like 'Thriller' or 'Romance' by changing the criteria within the formula. This flexibility allows for quick comparisons across different categories without manually sorting or filtering the data.
By following these steps, you can leverage the AVERAGEIF function to perform conditional averaging with ease, making it a powerful tool for data analysis in Excel.
AVERAGEIFS Function in Excel
The AVERAGEIFS function is an advanced average formula in Excel to compute the average for cells that meet multiple criteria. It is particularly useful when you need to filter and analyze data based on various conditions.
Syntax of AVERAGEIFS:
=AVERAGEIFS(average_range, criteria_range1, criteria1, [criteria_range2, criteria2, ...])
- average_range: The cells from which the average is calculated.
- criteria_range1, criteria_range2, ...: The ranges where the function checks for specified conditions.
- criteria1, criteria2, …: The conditions that determine which cells to include in the average.
Example: Calculating the Average Score of Advanced Students in Science
Suppose you want to find the average test score for students who are in the 'Advanced' level and have scored more than 80 in 'Science'.
Dataset Structure:
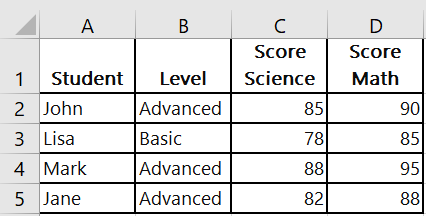
Steps to Use AVERAGEIFS Function:
- Select the Output Cell: E.g., F3.
- Enter the Function: Type `=AVERAGEIFS(C2:C5, B2:B5, "Advanced", C2:C5, ">80")`.
- Define the Ranges and Criteria:
Average Range: C2:C5 (Score Science)
First Criteria Range: B2:B5 (Level)
First Criteria: "Advanced"
Second Criteria Range: C2:C5 (Score Science)
Second Criteria: ">80"
- Execute the Function: Hit Enter.
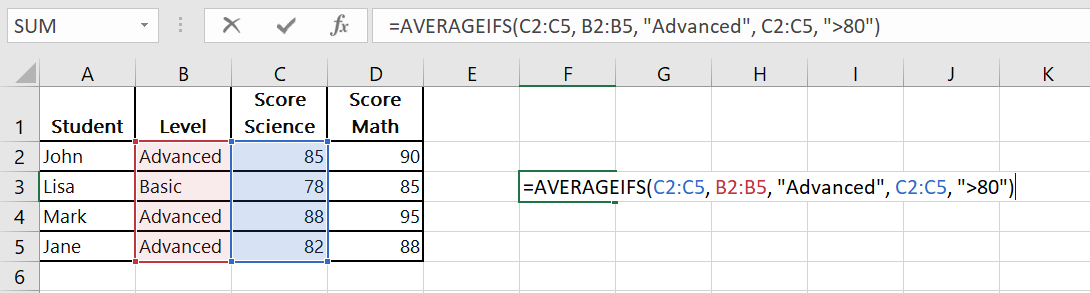
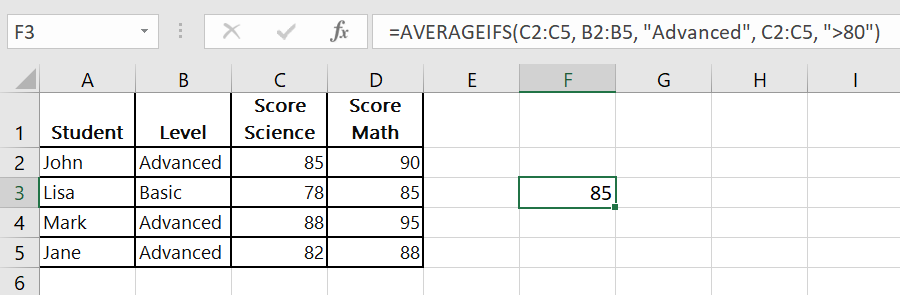
After entering this formula, Excel calculates the average Science score for 'Advanced' students scoring over 80, which in this case would be the average of 85, 88, and 82, resulting in approximately 85.
Adapting AVERAGEIFS for Different Criteria:
The AVERAGEIFS function is highly versatile. For example, if you wanted to include only the students who scored above 85 in Math as well, simply add another criteria range and condition to your formula.
Note:
- Make sure to separate function arguments with a comma (`,`) or a semicolon (`;`) based on your regional settings in Excel.
- Using absolute references (like `$B$2:$B$5`) in your criteria ranges can help when copying the formula across multiple cells without changing the reference.
The AVERAGEIFS function is a powerful tool for digging deeper into data and extracting specific insights based on multiple conditions, making it indispensable for detailed data analysis in Excel.
Final Words
Average functions in Excel span from simple `AVERAGE` to the more complex `AVERAGEIF` and `AVERAGEIFS`. These tools not only simplify the process of calculating arithmetic means but also introduce the capability to perform conditional averaging.
This is especially important for sectors like business analytics, where understanding specific trends or conditions can directly influence strategic decisions. This makes Excel's average functions not just tools for calculation but also for strategic analysis and planning.
To enhance your proficiency in Excel, you might consider joining the free certified course provided by upGrad. upGrad also has various accredited programs that can greatly expand your knowledge and skills, equipping you for sophisticated data management in any professional environment.
Frequently Asked Questions
1. How do I do an average formula in Excel?
Pick a cell where you want the average. Type `=AVERAGE(` there. Select numbers from, say, A1 to A5. End with `)`. Hit Enter. This shows the average of A1 to A5. Pick a cell where you want the average. Type ` =AVERAGE( ` there. Select numbers from, say, A1 to A5. End with `)`. Hit Enter. This shows the average of A1 to A5. What is the average formula of a function?
2. What is the average formula of a function?
Average formula in excel is `=AVERAGE(`cells you're averaging). For ex., =AVERAGE(A1:A5). This tells Excel to add the values from cells A1 to A5 and divide by the number of entries and hence calculate the mean. Average formula in excel is ` =AVERAGE( ` cells you're averaging ) . For ex., =AVERAGE(A1:A5) . This tells Excel to add the values from cells A1 to A5 and divide by the number of entries and hence calculate the mean. What are the 3 ways to calculate average?
3. What are the 3 ways to calculate average?
For averaging data in Excel, there are three effective methods: 1. Simple AVERAGE Function: Calculates the basic arithmetic mean. 1. Simple AVERAGE Function : Calculates the basic arithmetic mean. 2. AVERAGEIF for Specific Criteria: Useful for averaging data that meets a particular condition. Formula: `=AVERAGEIF(range, "criteria")`. 2. AVERAGEIF for Specific Criteria : Useful for averaging data that meets a particular condition. Formula: ` =AVERAGEIF(range, "criteria") `. 3. AVERAGEIFS for Multiple Criteria: Allows averaging over multiple conditions simultaneously. Use: 3. AVERAGEIFS for Multiple Criteria : Allows averaging over multiple conditions simultaneously. Use: `=AVERAGEIFS(average_range, criteria_range1, criteria1, ...)`. ` =AVERAGEIFS(average_range, criteria_range1, criteria1, ...) ` . What is the Averageif function in Excel?
4. What is the Averageif function in Excel?
In Excel, the `AVERAGEIF` function is `=AVERAGEIF(range, criteria, [average_range])`. Here: In Excel, the ` AVERAGEIF ` function is ` =AVERAGEIF(range, criteria, [average_range]) `. Here: range is where the function looks for the condition.criteria explains which cells to average, based on the condition set.[average_range] is optional and indicates where to derive the averages from; if not specified, the "range" is utilized for both checking the condition and calculating the average. range is where the function looks for the condition. range is where the function looks for the condition. criteria explains which cells to average, based on the condition set. criteria explains which cells to average, based on the condition set. [average_range] is optional and indicates where to derive the averages from; if not specified, the "range" is utilized for both checking the condition and calculating the average. [average_range] is optional and indicates where to derive the averages from; if not specified, the "range" is utilized for both checking the condition and calculating the average. How do I get average formula?
5. How do I get average formula?
To apply the average formula in Excel, you employ the `AVERAGE` function. The general form you use is To apply the average formula in Excel, you employ the ` AVERAGE ` function. The general form you use is =AVERAGE(number1, [number2], ...)`. = AVERAGE ( number1 , [ number2 ] , ... ) ` . What is the average of a function?
6. What is the average of a function?
The average function related to Excel doesn't have a direct relation to the concept of function averages, unless you mean averaging results produced by formulas or other functions in a dataset. Use =AVERAGE(range), where 'range' is the cells containing function outputs. The average function related to Excel doesn't have a direct relation to the concept of function averages, unless you mean averaging results produced by formulas or other functions in a dataset. Use =AVERAGE(range) , where 'range' is the cells containing function outputs. What are the 3 types of averages?
7. What are the 3 types of averages?
The three types of averages are as follows: Simple AVERAGE Function: Calculates the basic arithmetic mean.AVERAGEIF for Specific Criteria: Useful for averaging data that meets a particular condition.AVERAGEIFS for Multiple Criteria: Allows averaging over multiple conditions simultaneously. Simple AVERAGE Function: Calculates the basic arithmetic mean. Simple AVERAGE Function : Calculates the basic arithmetic mean. AVERAGEIF for Specific Criteria: Useful for averaging data that meets a particular condition. AVERAGEIF for Specific Criteria : Useful for averaging data that meets a particular condition. AVERAGEIFS for Multiple Criteria: Allows averaging over multiple conditions simultaneously. AVERAGEIFS for Multiple Criteria : Allows averaging over multiple conditions simultaneously. Is there an average if function?
8. Is there an average if function?
Yes, there is a function named AVERAGEIF. This function comes in need in situations where you only need the average from a subset of data that satisfies certain conditions, rather than all of the data in your dataset. Yes, there is a function named AVERAGEIF . This function comes in need in situations where you only need the average from a subset of data that satisfies certain conditions, rather than all of the data in your dataset.

Author|15 articles published


upGrad Learner Support
Talk to our experts. We are available 7 days a week, 10 AM to 7 PM
Indian Nationals
Foreign Nationals
