All courses
Agentic AI
Agentic AI

IIIT Bangalore
Executive Programme in Generative AI for LeadersArtificial Intelligence
Degree / Exec. PG

IIIT Bangalore
Executive Diploma in Machine Learning and AI
OPJ Global University
Master’s Degree in Artificial Intelligence and Data Science
Liverpool John Moores University
Master of Science in Machine Learning & AI
Golden Gate University
DBA in Emerging Technologies with Concentration in Generative AIExecutive Certificate

IIITB & IIM, Udaipur
Chief Technology Officer & AI Leadership ProgrammeIIIT Bangalore
Executive Programme in Generative AI for Leaders
upGrad | Microsoft
Gen AI Foundations Certificate Program from MicrosoftupGrad | Microsoft
Gen AI Mastery Certificate for Data AnalysisupGrad | Microsoft
Gen AI Mastery Certificate for Software DevelopmentupGrad | Microsoft
Gen AI Mastery Certificate for Managerial ExcellenceOffline Bootcamps

upGrad
Data Science and AI-MLDoctorate
For All Domains
IIITB & IIM, Udaipur
Chief Technology Officer & AI Leadership Programme
Swiss School of Business and Management
Global Doctor of Business Administration from SSBM
Edgewood University
Doctorate in Business Administration by Edgewood UniversityGolden Gate University
Doctor of Business Administration From Golden Gate University
Rushford Business School
Doctor of Business Administration from Rushford Business School, SwitzerlandGolden Gate University
Master + Doctor of Business Administration (MBA+DBA)-d9bdeff6165f4eb1ba2adcebde78e961.svg)
University of Waterloo
Chief Technology and AI Officer ProgramLeadership / AI
Golden Gate University
DBA in Emerging Technologies with Concentration in Generative AIMachine Learning
Machine Learning
Data Science
Degree / Exec. PG
O.P Jindal Global University
Master’s Degree in Artificial Intelligence and Data ScienceIIIT Bangalore
Executive Diploma in Data Science & AILiverpool John Moores University
Master of Science in Data ScienceExecutive Certificate
upGrad | Microsoft
Gen AI Foundations Certificate Program from MicrosoftupGrad | Microsoft
Gen AI Mastery Certificate for Data AnalysisupGrad | Microsoft
Gen AI Mastery Certificate for Software DevelopmentupGrad | Microsoft
Gen AI Mastery Certificate for Managerial ExcellenceupGrad | Microsoft
Gen AI Mastery Certificate for Content CreationOffline Bootcamps
upGrad
Data Science and AI-MLupGrad
Data AnalyticsMBA
Masters

Paris School of Business
Master of Science in Business Management and TechnologyO.P.Jindal Global University
MBA (with Career Acceleration Program by upGrad)Edgewood University
MBA from Edgewood UniversityO.P.Jindal Global University
MBA from O.P.Jindal Global UniversityGolden Gate University
Master + Doctor of Business Administration (MBA+DBA)Executive Certificate

IMT, Ghaziabad
Advanced General Management ProgramMarketing
Executive Certificate
Offline Bootcamps
upGrad
Digital MarketingManagement
Degree
O.P Jindal Global University
MSc in International Accounting & Finance (ACCA integrated)Paris School of Business
Master of Science in Business Management and Technology
Golden Gate University
Master of Arts in Industrial-Organizational PsychologyExecutive Certificate

IIIT-B & IIM, Udaipur
Chief Technology Officer & AI Leadership Programme
IIM Kozhikode
Human Resource Analytics Course from IIM-KupGrad | Microsoft
Gen AI Foundations Certificate Program from MicrosoftEducation
Education

Northeastern University
Master of Education (M.Ed.) from Northeastern UniversityEdgewood University
Doctor of Education (Ed.D.)Edgewood University
Master of Education (M.Ed.) from Edgewood UniversityCertifications
Project Management
Certification

Knowledgehut
Leadership And Communications In ProjectsKnowledgehut
Microsoft Project 2007/2010-ae8d039bbd2a41318308f8d26b52ac8f.svg)
Knowledgehut
Financial Management For Project ManagersKnowledgehut
Fundamentals of Earned Value Management (EVM)Knowledgehut
Fundamentals of Portfolio ManagementKnowledgehut
Fundamentals of Program Management-35c169da468a4cc481c6a8505a74826d.webp&w=128&q=75)
Knowledgehut
CAPM® CertificationsKnowledgehut
Microsoft® Project 2016Certifications & Trainings
-7f4b4f34e09d42bfa73b58f4a230cffa.webp&w=128&q=75)
Knowledgehut
PMP® CertificationKnowledgehut
PMI-RMP® CertificationKnowledgehut
PMP Renewal Learning PathKnowledgehut
Oracle Primavera P6 V18.8Knowledgehut
Microsoft® Project 2013Knowledgehut
PfMP® Certification CourseKnowledgehut
Project Planning and MonitoringPrince2 Certifications

Knowledgehut
PRINCE2® FoundationKnowledgehut
PRINCE2® PractitionerKnowledgehut
PRINCE2 Agile Foundation and PractitionerKnowledgehut
PRINCE2 Agile® Foundation CertificationKnowledgehut
PRINCE2 Agile® Practitioner CertificationManagement Certifications
Knowledgehut
Project Management Masters Certification ProgramKnowledgehut
Change ManagementKnowledgehut
Project Management TechniquesKnowledgehut
Product Management Certification ProgramKnowledgehut
Project Risk Management- Study abroad
- Offline centres
- uGSOT - B.Tech
More


27. Columns in Excel
33. Count In Excel
49. Slicers in Excel
54. Solver in Excel
56. Macros In Excel
Charts in Excel: What They Are and How to Create Them
Excel is a leading platform for organizing, presenting, and analyzing data. Charts in Excel play a crucial role in visually understanding numbers and enhancing communication and decision-making. They are common in presentations due to their impactful visual representation. Excel offers various chart types like pie charts, bar charts, and column charts, which make data interpretation easier.
Excel charts have made it comparatively easy for me to make corporate presentations. Hence, I’ve been meaning to curate this guide to help you get a clear understanding of the same. I’ve listed the types, and even how to create them.
By the end, I am sure you will be confident enough to use Excel in your daily life and ace presentations. However, if you’re new to Excel, make sure you go through a comprehensive MS Excel step-by-step tutorial.
So, let's look at how to create charts in Excel.
How To Create a Chart?
Interpreting a heap of data can be an overwhelming task. The creation of charts comes to the rescue in situations like these. Excel provides you with different kinds of charts that can be customized once you master them.
Here are the steps to create charts in Excel.
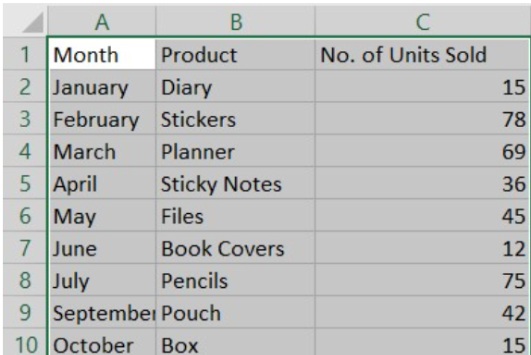
Step 1: Select the data that you have inserted.
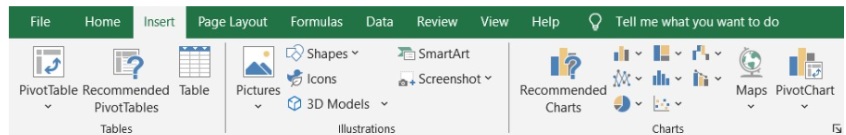
Step 2: Click on Insert and select any chart of your wish
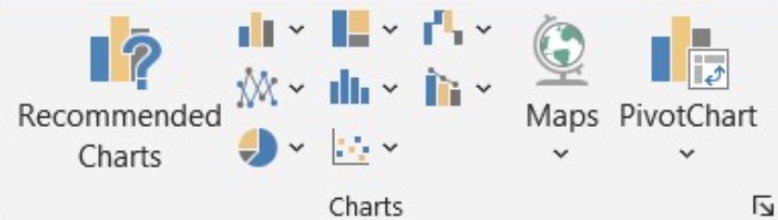
Step 3: Click on the down arrow and select any desired chart. The selected chart will be shown on the screen.
If you are new to Excel and unsure about which chart to choose, you can access recommended charts. This allows users to view previews of different chart options, assisting in making an informed decision.
Types of Charts
After establishing the structure for making a chart, let us take a closer look at each kind. Numerous chart types are supported by Excel, such as pie charts, bubble charts, column charts, bar charts, and hierarchical charts. These charts give a graphical interpretation of the provided data. Here are the types of charts in Excel with examples.
1. Bar Chart
Bar charts are used to depict data in rectangular bars displayed in a horizontal plane. It can be shown as the basic chart, which is commonly used to show progress.
There are three types of bar charts:
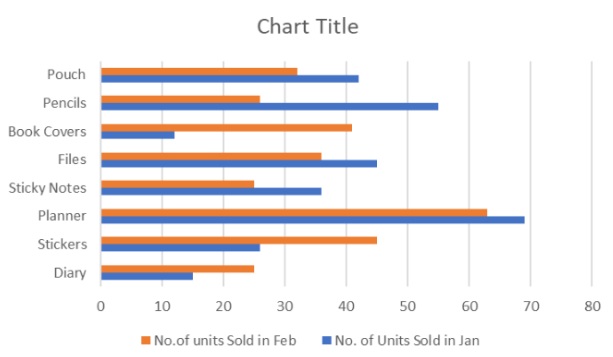
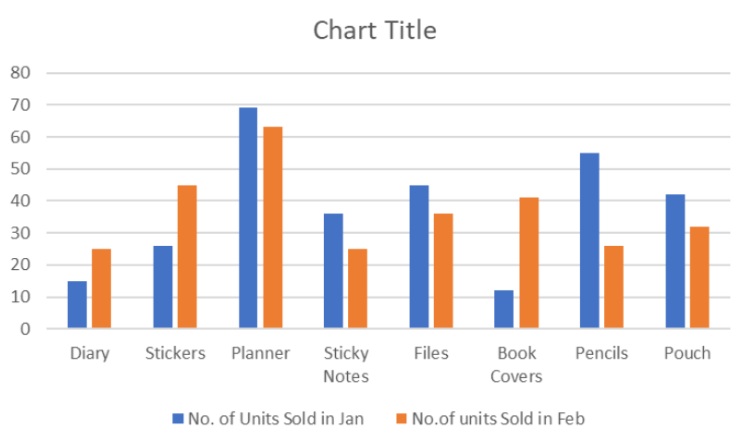
- Clustered bar chart: One of the main Excel chart types in bar style is the clustered bar chart. It is used to show the comparison of the data. The chart given below is a clustered chart comparing the sales over two months.
- Stacked bar chart: A stacked bar is a far more advanced type where the total number from each category is highlighted and the data is stacked at the end of each category. An example is given below:
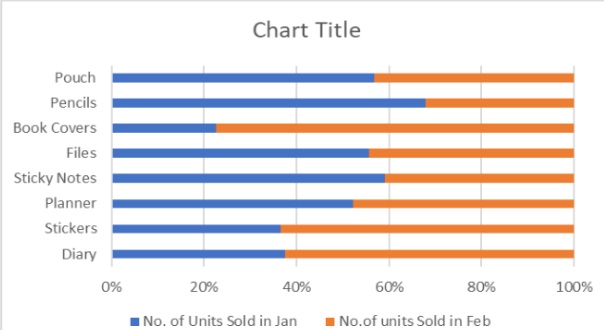
A 100% stacked bar gives the percentage value of each proportion, providing a percent value. Given below is an example of a 100% stacked bar.
2. Column Chart
Column charts, like bar charts, use vertical bars to display data in the most straightforward manner possible. It is widely used for qualitative data analysis. Column charts, which are available in three versions—clustered, stacked, and 100% stacked—are among the most popular Excel chart types due to their clarity and ability to provide more detailed information.
A clustered column chart prioritizes data over its order. An example of the same is given below.
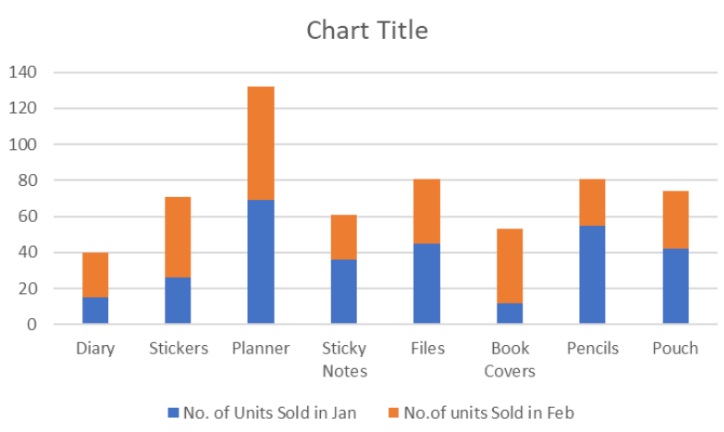
- Stacked column chart: Similar to a stacked bar chart, a stacked column chart displays the total number in each category. The bars are stacked on top of one another, which is the only distinction. Example:
- 100% stacked column chart: A 100% stacked column chart is used when there is more than one data column and the difference is the presence of vertical bars.
3. Pie Chart
As easy as the name suggests, pie charts look like pie slices aligned together to form a circle, where the slices are the data. It is among the most aesthetically beautiful and memorable charts because it adds richness to your presentations. It catches the eye of the listener, as the individual contribution to the whole is primarily focused upon. It has two types, which are explained below with examples.
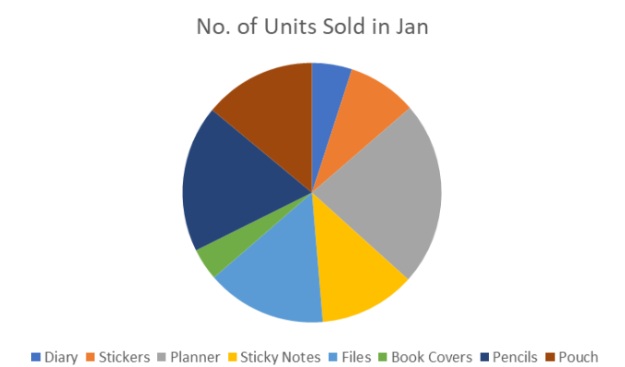
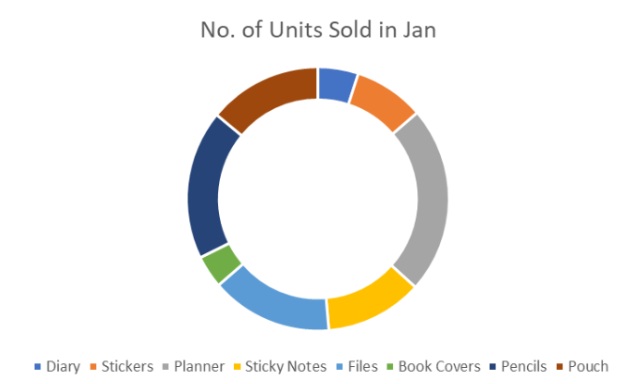
2-D Pie is frequently used when you have one data column, as it can be effortlessly arranged in a circle. Here is an effective example I have provided below. It shows the number of units sold in January.
- Doughnut pie: A doughnut pie is the same as a 2-D pie; the only difference is that it has a hollow center and can be used when there is more than one data column. An example:
4. Line Chart
One of its features is the ability to display data in straight lines. The progression can be easily visualized thanks to the use of lines to connect data points. A separate line is given for each of the data for its representation. Line charts come in six varieties. They are:
- Line
- Line with markers
- Stacked line
- Stacked line with markers
- 100% stacked line
- 100% stacked line with markers.
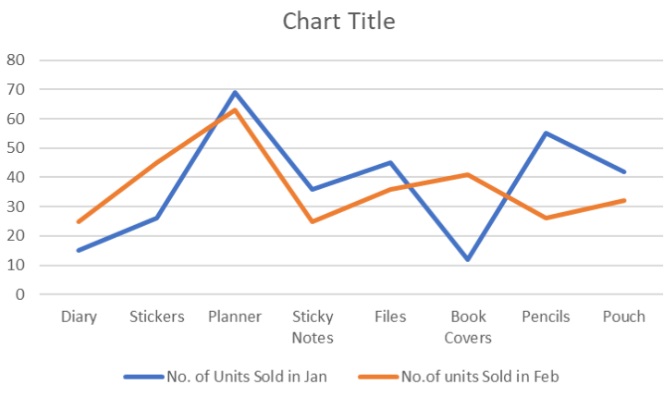
A line chart is the most basic type, created by connecting the data points to create a line. A line with markers chart will have a huge mark on the spots, which showcases the accurate data, making the chart deeply understandable.
Given below is an example of a line chart which shows the number of units sold in Jan and Feb.
The stacked line chart is used when there is more data, where one line is stacked on top of the other. Similar to line with markers, a stacked line with markers has a dot highlighting the accurate data. An example of a stacked line chart is given below:
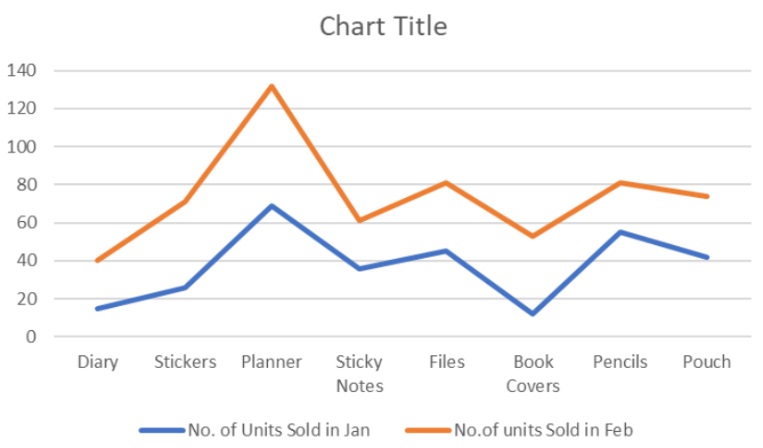
A 100% stacked line chart is used with data which are in ascending order. It represents the total proportion clearly.
5. Radar Chart
Radar charts, which are also referred to as spider charts, web charts, etc. due to their appearance, are particularly good at displaying the efficacy of multiple variables across various categories, making them perfect for assessing complex data sets. Remember that when comparing three or more data sets, radar charts work best.
The distance from the center of the point shows the accurate data. I know it can get you confused at first, but trust me once you get how it works it will save you time.
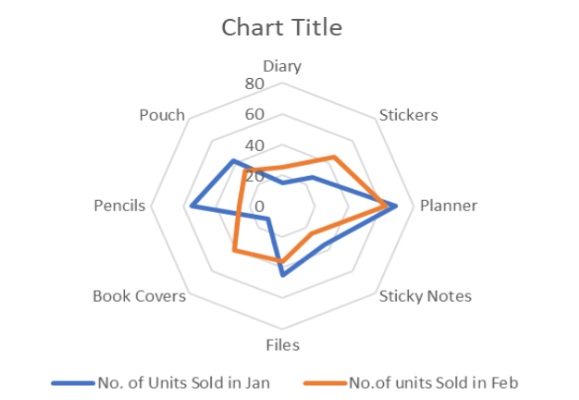
Just like other charts, it has three types. They are radar, radar with markers, and filled radar. The only differences between filled radar and radar with markers are that the latter has color filled inside the figure, while the former has highlighted points. Here is an example of a radar chart representing the sale of goods in Jan and Feb.
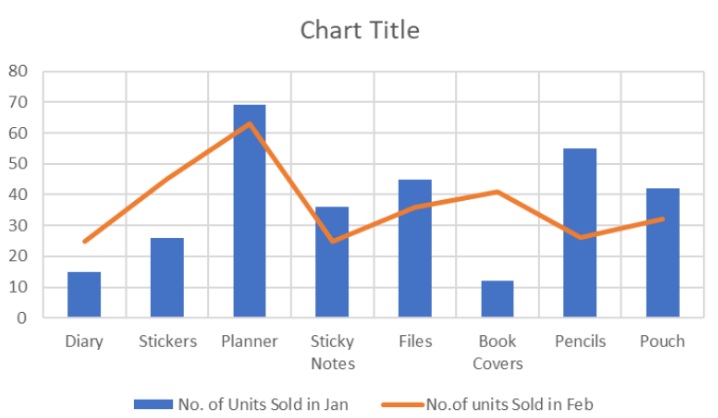
6. Combo Chart
A combo chart in Excel is a combination of two types of charts to form a single one for easy access to data that is analyzed and interpreted accurately. When making a combo chart, the only thing you need to remember is that you need two sets of data, with one variable shared by both.
Charts in Excel come with ready-made combo charts, among which one is a clustered column line chart. You can showcase your talent for forming combo charts by exploring the charts section. You can do so by clicking on the ‘Create Custom Combo Chart’ option.
Here is an image of the clustered column line chart.
7. Other Charts in Excel
Excel provides other types of charts, which include:
- Waterfall- An Excel chart used to analyze data and understand how the starting value of a variable changes over a period of time. It is frequently used to analyze budgets and comprehend profit and loss.
- Funnel: It has stages that are segments that get smaller as they go down, much like a funnel. It represents the change in variables at different stages. The main purpose of it is to comprehend sales.
- Stock- Just like the name clarifies, it is used to understand stocks and their variations.
- Surface- A three-dimensional chart that is unique in its appearance as it looks similar to a topographical map. The use of different vibrant colors makes it visually pleasing.
- Hierarchy chart- It has two types of charts called treemap and sunburst. A treemap chart displays the data as a set of rectangles with different colors representing different variables, whereas Sunburst uses concentric circles for data interpretation.
- Histogram: A histogram is a statistical chart that uses plotted bars to represent a particular category or class interval. It shows the distribution of constant data. Another kind of statistical chart that displays the distribution of data along with its variation is the box and whiskers chart.
- Scatter Charts- Scatter charts offer diverse options for visualizing data relationships. Classic scatter charts provide pinpoint accuracy, while scatter charts with smooth lines offer a flowing wave pattern. Adding markers enhances clarity. Conversely, scatter charts with straight lines provide a concise representation of data relationships.
Takeaways
Excel charts have been a lifesaver for me. The charts in Excel have the most interesting way of data interpretation and analysis. You are also left with a format option where Excel chart formatting can be done. In the hopes that your creative mind can master charts and customize them to form the best charts, I have put together this Excel chart tutorial with basic explanations and images of various types of charts.
If you are planning to master the usage of Excel and improve your career, then hop on to the official website of upGrad for more certified courses. Top universities offer highly regarded certifications, and upGrad is the best platform to gain those certifications.
Frequently Asked Questions
1. What are the 4 most commonly used charts in Excel?
The four commonly used charts in Excel include bar charts, line charts, column charts, and pie charts. What are the different types of charts?
2. What are the different types of charts?
Excel puts forward different types of Excel chart designs which include bar charts, line charts, column charts, pie charts, radar charts, statistical charts, waterfall, funnels, bubble charts, etc. What do you mean chart?
3. What do you mean chart?
In Excel, charts are considered as a way in which data is represented visually. What is bar chart in Excel?
4. What is bar chart in Excel?
A Bar chart is a type of chart in which data is represented using rectangular bars displayed in a horizontal plane. What is a combo chart?
5. What is a combo chart?
A combo chart in Excel is a form of chart where two charts are combined to form a new type of chart How to make a combo plot in Excel?
6. How to make a combo plot in Excel?
A combo plot can be made by: Selecting the dataClick on the Insert buttonClick combo chartsSelect the type of chart that you want to combine. Selecting the data Click on the Insert button Click combo charts Select the type of chart that you want to combine. Can I combine 2 charts in Excel?
7. Can I combine 2 charts in Excel?
Yes, Excel promotes a special Excel chart formatting wherein two charts are combined. These are called combo charts.

Author|15 articles published


upGrad Learner Support
Talk to our experts. We are available 7 days a week, 10 AM to 7 PM
Indian Nationals
Foreign Nationals
Disclaimer
The above statistics depend on various factors and individual results may vary. Past performance is no guarantee of future results.
The student assumes full responsibility for all expenses associated with visas, travel, & related costs. upGrad does not .