All courses
Agentic AI
Agentic AI

IIIT Bangalore
Executive Programme in Generative AI for LeadersArtificial Intelligence
Degree / Exec. PG

IIIT Bangalore
Executive Diploma in Machine Learning and AI
OPJ Global University
Master’s Degree in Artificial Intelligence and Data Science
Liverpool John Moores University
Master of Science in Machine Learning & AI
Golden Gate University
DBA in Emerging Technologies with Concentration in Generative AIExecutive Certificate

IIITB & IIM, Udaipur
Chief Technology Officer & AI Leadership ProgrammeIIIT Bangalore
Executive Programme in Generative AI for Leaders
upGrad | Microsoft
Gen AI Foundations Certificate Program from MicrosoftupGrad | Microsoft
Gen AI Mastery Certificate for Data AnalysisupGrad | Microsoft
Gen AI Mastery Certificate for Software DevelopmentupGrad | Microsoft
Gen AI Mastery Certificate for Managerial ExcellenceOffline Bootcamps

upGrad
Data Science and AI-MLDoctorate
For All Domains
IIITB & IIM, Udaipur
Chief Technology Officer & AI Leadership Programme
Swiss School of Business and Management
Global Doctor of Business Administration from SSBM
Edgewood University
Doctorate in Business Administration by Edgewood UniversityGolden Gate University
Doctor of Business Administration From Golden Gate University
Rushford Business School
Doctor of Business Administration from Rushford Business School, SwitzerlandGolden Gate University
Master + Doctor of Business Administration (MBA+DBA)-d9bdeff6165f4eb1ba2adcebde78e961.svg)
University of Waterloo
Chief Technology and AI Officer ProgramLeadership / AI
Golden Gate University
DBA in Emerging Technologies with Concentration in Generative AIMachine Learning
Machine Learning
Data Science
Degree / Exec. PG
O.P Jindal Global University
Master’s Degree in Artificial Intelligence and Data ScienceIIIT Bangalore
Executive Diploma in Data Science & AILiverpool John Moores University
Master of Science in Data ScienceExecutive Certificate
upGrad | Microsoft
Gen AI Foundations Certificate Program from MicrosoftupGrad | Microsoft
Gen AI Mastery Certificate for Data AnalysisupGrad | Microsoft
Gen AI Mastery Certificate for Software DevelopmentupGrad | Microsoft
Gen AI Mastery Certificate for Managerial ExcellenceupGrad | Microsoft
Gen AI Mastery Certificate for Content CreationOffline Bootcamps
upGrad
Data Science and AI-MLupGrad
Data AnalyticsMBA
Masters

Paris School of Business
Master of Science in Business Management and TechnologyO.P.Jindal Global University
MBA (with Career Acceleration Program by upGrad)Edgewood University
MBA from Edgewood UniversityO.P.Jindal Global University
MBA from O.P.Jindal Global UniversityGolden Gate University
Master + Doctor of Business Administration (MBA+DBA)Executive Certificate

IMT, Ghaziabad
Advanced General Management ProgramMarketing
Executive Certificate
Offline Bootcamps
upGrad
Digital MarketingManagement
Degree
O.P Jindal Global University
MSc in International Accounting & Finance (ACCA integrated)Paris School of Business
Master of Science in Business Management and Technology
Golden Gate University
Master of Arts in Industrial-Organizational PsychologyExecutive Certificate

IIIT-B & IIM, Udaipur
Chief Technology Officer & AI Leadership Programme
IIM Kozhikode
Human Resource Analytics Course from IIM-KupGrad | Microsoft
Gen AI Foundations Certificate Program from MicrosoftEducation
Education

Northeastern University
Master of Education (M.Ed.) from Northeastern UniversityEdgewood University
Doctor of Education (Ed.D.)Edgewood University
Master of Education (M.Ed.) from Edgewood UniversityCertifications
Project Management
Certification

Knowledgehut
Leadership And Communications In ProjectsKnowledgehut
Microsoft Project 2007/2010-ae8d039bbd2a41318308f8d26b52ac8f.svg)
Knowledgehut
Financial Management For Project ManagersKnowledgehut
Fundamentals of Earned Value Management (EVM)Knowledgehut
Fundamentals of Portfolio ManagementKnowledgehut
Fundamentals of Program Management-35c169da468a4cc481c6a8505a74826d.webp&w=128&q=75)
Knowledgehut
CAPM® CertificationsKnowledgehut
Microsoft® Project 2016Certifications & Trainings
-7f4b4f34e09d42bfa73b58f4a230cffa.webp&w=128&q=75)
Knowledgehut
PMP® CertificationKnowledgehut
PMI-RMP® CertificationKnowledgehut
PMP Renewal Learning PathKnowledgehut
Oracle Primavera P6 V18.8Knowledgehut
Microsoft® Project 2013Knowledgehut
PfMP® Certification CourseKnowledgehut
Project Planning and MonitoringPrince2 Certifications

Knowledgehut
PRINCE2® FoundationKnowledgehut
PRINCE2® PractitionerKnowledgehut
PRINCE2 Agile Foundation and PractitionerKnowledgehut
PRINCE2 Agile® Foundation CertificationKnowledgehut
PRINCE2 Agile® Practitioner CertificationManagement Certifications
Knowledgehut
Project Management Masters Certification ProgramKnowledgehut
Change ManagementKnowledgehut
Project Management TechniquesKnowledgehut
Product Management Certification ProgramKnowledgehut
Project Risk Management- Study abroad
- Offline centres
- uGSOT - B.Tech
More


27. Columns in Excel
33. Count In Excel
49. Slicers in Excel
54. Solver in Excel
56. Macros In Excel
Slicers in Excel
In analyzing data, we all know that there is no other like Microsoft Excel. But do you sometimes feel overwhelmed by the endless rows and columns of data in Excel like me? Let me tell you, a new trick and a few clicks can save your day.
Did you know there is a special filter called Slicers in Excel that can operate your data sheet without you hunting down the dropdown lists? Specifically designed for Excel tables and pivot tables, Slicers in Excel saves my time and mental strain everyday, and make my daily Excel tasks much more efficient.
Slicers were first introduced in Microsoft Excel with the release of Excel 2010. From this onwards, Microsoft Excel updated itself in data analysis. If you need to know more about Excel from scratch, head straight to the Excel beginner’s guide to learn the basics. Fear not, we all start from somewhere!
How to Add Slicers in Excel?
As I take charge in introducing you to slicers in Excel, let me start by explaining how you can add slicers in Excel.
While working with a large set of data, it is always best if you use Slicers to make your job easy. They are interactive visual filters specifically designed for Excel tables and pivot tables. The best part is, they are super user-friendly and time saving.
You can use slicers for both tables and pivot tables. Below, I have made an Excel slicer tutorial that will break down the steps to add slicers in your excel sheet for you:
How to add Slicer in Excel Data Table:
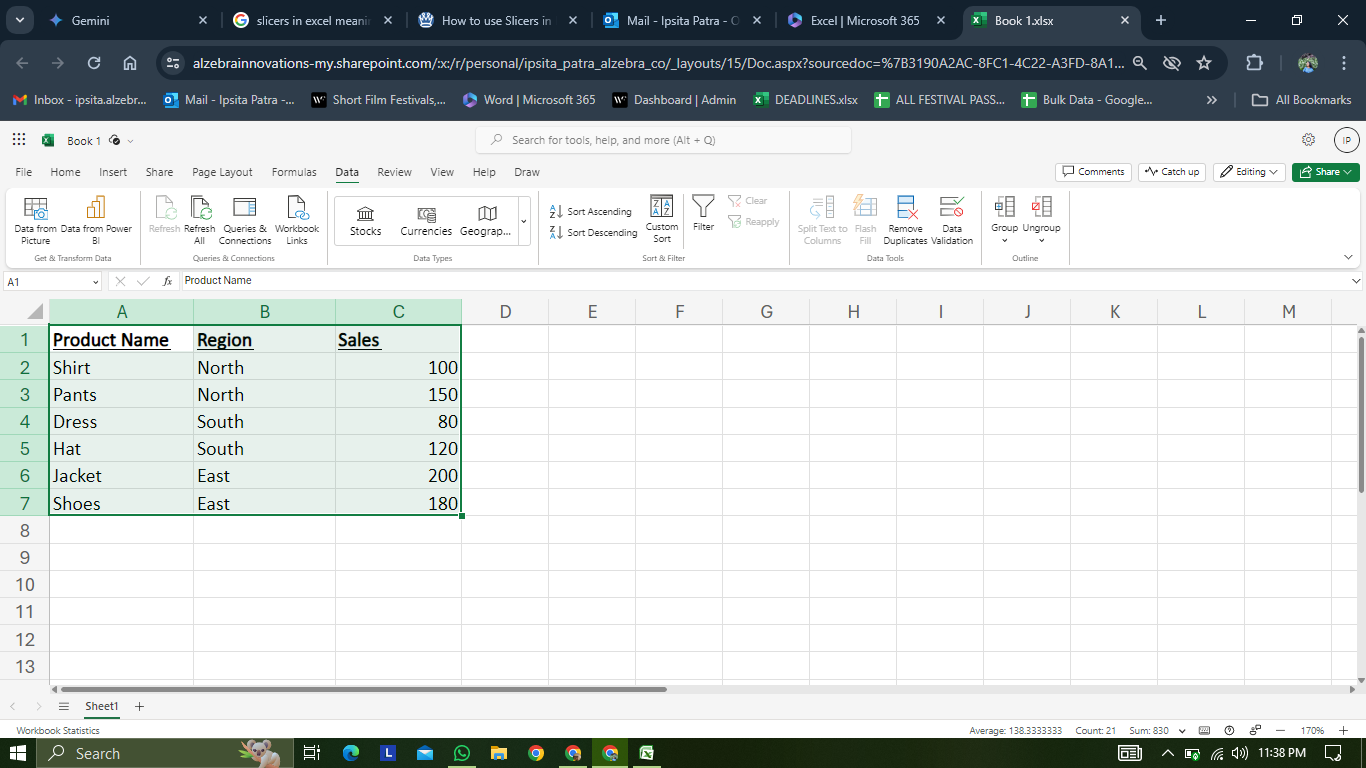
So, let me use a sample data table to show you how to add slicers in Excel. Here, you have a list of sales of different products across various regions, listed in three columns. Here's an example table:
1. Adding Slicers to Your Worksheet
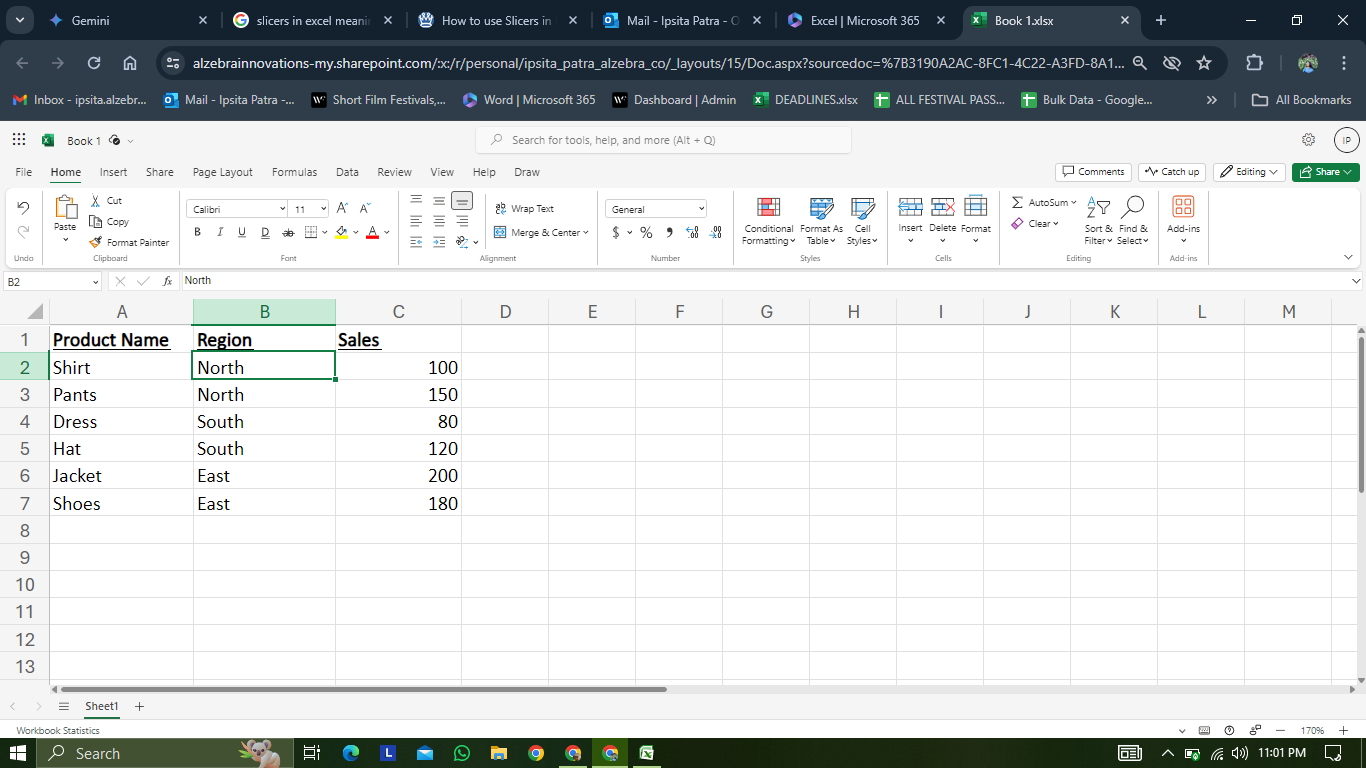
Select a Cell: Click on any cell within your data table. For example, click on the cell "B2" (Region: North).
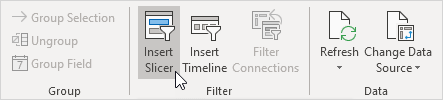
Insert the Slicer: In Excel insert Slicer by going to the Insert tab and locate the Filters section. Click the Slicer button.
Fields for Slicer: Here comes a window called ‘Insert Slicer’ will appear. This consists of all the columns of your table in checkboxes. Since we are focusing on filtering by region, select the checkbox next to the "Region" field. You can leave other checkboxes deselected for now.
Click OK: You now created your slicer and position it on your worksheet by default. You'll see a list of all the regions ("North," "South," and "East") displayed in the slicer.
2. Filter by Region through Slicers:
Click on a Region: Click on a specific region in the slicer, for example, "North." This will filter your data table to only show sales figures for products sold in the North region.
Multiple Selections (Ctrl+Click): Long press the Ctrl key while clicking on multiple regions (e.g., "North" and "South"). This will filter the table to show data for products sold in both North and South regions.
How to add Slicer in Excel pivot table
Let us take the reference from the last example, but here you need to make a pivot table of your previous data.
If you don't have one, create one:
- Select the data range
- Go to the tab labeled ‘Insert’
- Click ‘PivotTable’.
- Choose where you want to place the pivot table
- Click OK.
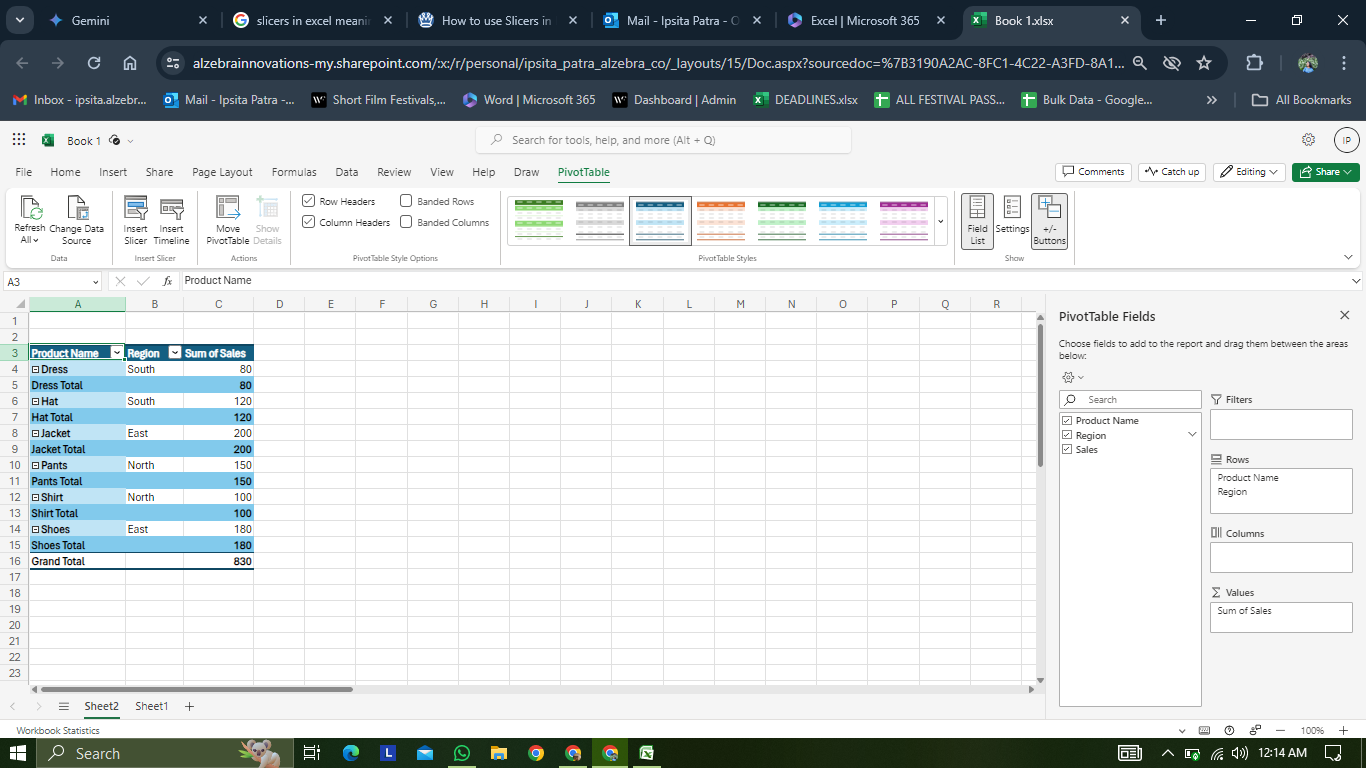
Your Pivot Table is ready to use. Learn more about the pivot tables and slicers to improve your excel knowledge. Next, in excel insert slicer by following this step by step guide:
1. Adding a Slicer:
Click in PivotTable: Click anywhere within your pivot table to ensure the slicer is linked to the correct data set.
Insert Slicer: Next, in Excel insert slicer by going to the ‘Analyze’ tab. In the Filter group, click on ‘Insert Slicer. Make sure your Pivot Table is selected, only then the Analyze tab will be visible.
Choose Fields for Slicer: The moment you click on the ‘Insert Slicer’ tab, a window named "Insert Slicers" will appear. This window consists of all the fields used in your pivot table. You can select the field(s) you want to use as slicer filters. Let's select the "Region" field here.
Click OK: This way, you are now successful to add slicers in Excel and place it on your worksheet. You can also drag and reposition it later.
2. Filter PivotTable Data:
Click on a Region: Your pivot table will automatically update to reflect the chosen region. For example, clicking on "North" in the slicer will show sales figures only for products sold in the North region.
Multiple Selections (Ctrl+Click): Hold the Ctrl key while clicking on multiple regions (e.g., "North" and "South"). This will filter the pivot table to show sales data for products sold in both selected regions. The pivot table will adjust accordingly.
Slicers vs Filter Excel: The Advance Usage of Slicers in Excel
Slicers do more beyond basic filtering in Excel. Unlike filters, it offers a variety of customization options to give you the best data exploration experience in Excel.
Visually Interactive Formatting Style:
Slicers are not just functional; they can be visually appealing too. You can modify their size, color, border style, and font.
For example: You can make the slicer for the "North" cells under Region category blue. It indicates all the products that are sold in the northern region and might match with your regional sales map. It also helps to distinguish Northern regions from every other area in your Excel data.
Layout Flexibility:
Gone are the days of static filter menus. Slicers in Excel offer great layout flexibility. You can arrange them horizontally, vertically, or even stack them on top of each other. This allows you to create a well-organized dashboard and suits your best needs.
For instance, if you have a limited amount of horizontal space, you can stack slicers for "Region," "Product Category," and "Price Range" to save space and maintain a clean layout.
Slicer Connections:
With slicers in Excel, you can choose individual items, and also can connect multiple slicers with slicer connections. It is particularly useful to analyze when you have large datasets.
For example, you have slicers for "Region" and "Sales Representative" in a sales report. By connecting these slicers, when you select a specific region, the "Sales Representative" slicer will automatically update to only show representatives working in that chosen region. This allows you to progressively filter your data.
Timeline Slicers:
Other than Regular Slicers, there is another type of slicer called Timeline Slicers. If you're working with data that includes dates or times, you can convert your slicer into a timeline slicer. This allows you to filter by specific date ranges, making it ideal for analyzing trends over time.
For example, you can use a timeline slicer to see how sales figures perform over the whole year.
Non-contiguous Selections:
If you hold the Ctrl key while clicking on slicer items, you can select non-consecutive options. This provides more individual control over your data view.
For example, you have a slicer for "Product Names" where you want to see sales data for "Shirt," and "Dress”. By using non-contiguous selection, you can quickly filter the data to include these specific categories.
Pivot Tables and Slicers:
In Excel, pivot tables and slicers allow you to control the data in your pivot table. This makes it easy to analyze different aspects of your data from a single pivot table.
For example, you have a pivot table containing the sales figures by region and product category. You can add slicers for both "Region" and "Product Category" to filter the pivot table and focus on specific areas of your interest, such as sales performance for Shirts in the North region.
Summing Up
In short, slicers in Excel have revolutionized data analyzing. Just like mine, these interactive visual filters can save your time too, unlike the traditional filter menus. They will effortlessly filter your data based on your specific interest, so you ace your data presentation every single time!
You can do a lot more than you can imagine with pivot tables and slicers in Excel. So, are you ready to be on top of your Excel game? Register yourself today to UpGrad’s free online Excel courses and make yourself pro at the field of data analysis today!
FAQs (Frequently Asked Questions)
1. What is the difference between filter and slicer in Excel?
Both slicers and filters allow you to refine your data view in Excel. The difference is: Filters: Filters are typically the dropdown menus or checkboxes within a column header. It sometimes becomes difficult to manage your data with numerous filtering options.Slicers: Slicers are interactive visual filters displayed as separate buttons or icons. This is a more user-friendly and intuitive way to filter data. Filters: Filters are typically the dropdown menus or checkboxes within a column header. It sometimes becomes difficult to manage your data with numerous filtering options. Slicers: Slicers are interactive visual filters displayed as separate buttons or icons. This is a more user-friendly and intuitive way to filter data.
2. Are Excel slicers only for pivot tables?
Slicers in Excel can be used with both Excel tables and pivot tables. They offer a more dynamic filtering experience compared to traditional filters in either format. Slicers in Excel can be used with both Excel tables and pivot tables. They offer a more dynamic filtering experience compared to traditional filters in either format.
3. How do I organize slicers in Excel?
You can easily drag and drop slicers anywhere on your worksheet to arrange them for optimal viewing. You can also group related slicers together for better organization.
4. What is a slicer caption in Excel?
The slicer caption is the text displayed at the top of a slicer. It indicates the field it has filtered. You can customize the caption by: Right-click on the slicerSelect "Format Slicer"Then select "Caption Properties." Right-click on the slicer Select "Format Slicer" Then select "Caption Properties."
5. Which is better, slicer or filter?
The slicer vs filter excel is an old debate. Slicers are easier to use and provide a clearer view of filtering options. However, filters might be more suitable for simple filtering tasks with a limited number of options.
6. Which is faster, slicer or filter?
Slicers in Excel might feel faster to you sometimes due to their visual and interactive design, allowing you to quickly filter data with a few clicks.
7. What are the two types of slicers?
You can add slicer in Excel for different data types, such as: Standard Slicers: to filter categorical data like product categories, regions, or dates.Timeline Slicers: to filter data by specific date ranges. Standard Slicers: to filter categorical data like product categories, regions, or dates. Timeline Slicers: to filter data by specific date ranges.
8. Why use slicers in Excel?
Here are some key reasons to add slicers in Excel: provides a user-friendly way to filter data with simple clicks.visually represents the filtering options, making it easier to understand how your data is filtered.allows you to quickly switch between filters and observe the corresponding changes.can be incorporated into reports and dashboards, making it easier for us to interact with the data. provides a user-friendly way to filter data with simple clicks. visually represents the filtering options, making it easier to understand how your data is filtered. allows you to quickly switch between filters and observe the corresponding changes. can be incorporated into reports and dashboards, making it easier for us to interact with the data.
9. What is the benefit of using a slicer?
The benefits of using slicers in Excel are: The benefits of using slicers in Excel are: It saves time. Filtering data becomes faster and more efficient.It reduces complex filter options as they are visually interactive.It improves your data insights as you can see the data from various angles.Slicers help create clear and interactive reports that you can easily understand. It saves time. Filtering data becomes faster and more efficient. It reduces complex filter options as they are visually interactive. It improves your data insights as you can see the data from various angles. Slicers help create clear and interactive reports that you can easily understand.

Author|15 articles published


upGrad Learner Support
Talk to our experts. We are available 7 days a week, 10 AM to 7 PM
Indian Nationals
Foreign Nationals
Disclaimer
The above statistics depend on various factors and individual results may vary. Past performance is no guarantee of future results.
The student assumes full responsibility for all expenses associated with visas, travel, & related costs. upGrad does not .