For working professionals
For fresh graduates
- Study abroad
More
- Post Graduate Certificate in Product Management from Duke CE
- Human Resource Analytics Course from IIM-K
- Global Master Certificate in Integrated Supply Chain Management
- The U & AI GenAI Certificate Program from Microsoft
- CSM® Certification Training
- CSPO® Certification Training
- PMP® Certification Training
- SAFe® 6.0 Product Owner Product Manager (POPM) Certification
- Post Graduate Certificate in Product Management from Duke CE
- Professional Certificate Program in Cloud Computing and DevOps
- Python Programming Course
- Executive Post Graduate Programme in Software Dev. - Full Stack
- AWS Solutions Architect Training
- AWS Cloud Practitioner Essentials
- AWS Technical Essentials
- The U & AI GenAI Certificate Program from Microsoft

27. Columns in Excel
33. Count In Excel
49. Slicers in Excel
54. Solver in Excel
56. Macros In Excel
Excel What-If Analysis
Analysing What-If scenarios is a crucial feature in Microsoft Excel. It provides answers to hypothetical questions like, “What if I change the value of a specific cell?”
The MS Excel What If analysis does this for you without erasing the first input. It shows how the change in values will affect the final output. The Excel What If analysis tool came in handy when I wanted to explore possibilities. It helped me make better decisions as I could understand how different factors influence the final result.
However, it can be tricky to navigate for beginners. Hence, I have designed this beginner-friendly tutorial to help you master the tool. Just in case you are new to Excel, go through the detailed tutorial on MS Excel.
What is What-If Analysis?
It is generally considered a process in Excel where the variables given in specific cells are changed to see the difference in the output and understand how it changes as the values keep changing. The major plus is that you need not create a different sheet for different values, as all these happen on one sheet itself.
As a businessman, I often find myself asking questions like,
“What if I decrease the cost of the product? Will it have an effect on the total income?”
“Should I conduct a buy one, get one free flash sale?” and the like.
Excel What If analysis comes to the rescue in these situations, as you can have a clear answer to these questions. “How to use Excel What If analysis?” might be the next question that needs to be answered. Let’s answer it.
To activate a What-If analysis, select ‘Data’ from the ‘Menu’ tab and ‘What If Analysis’ from the ‘Forecast’ section.
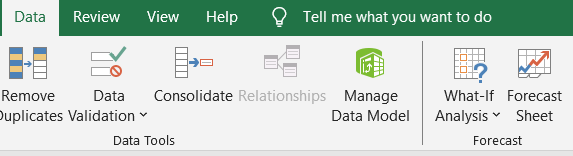
As you go through the drop-down arrow of What If analysis, you will see three different types: scenario manager, goal seeker, and data table. Among these three types, Data Table and Scenario manager show similar traits, but goal seeking is different.
Scenario Manager
The action of the tool is just what its name suggests. It has a great ability to create scenarios by changing the variables in different cells. It generates several scenario summary sheets for various scenarios, which facilitates comprehension of how specific values impact the final result.
It is formally seen as a lifesaver for financial modelling and project planning due to its unfathomable ability to make accurate decisions that result in a good impact on the company and its revenue. Hence, it is appreciated as a primary use of What If analysis in Excel.
This feature generates a separate summary report for scenario analysis, preserving the main sheet. It enables manipulation of up to 32 variables or values, creating 32 unique scenarios for detailed analysis and competitive advantage.
How Do I Use Scenario Manager?
What If analysis tool is extensively used in data analysis. “How to do a What If analysis Excel” is a common question that arises while using Excel. So, let’s answer those questions by looking at the first type of What If analysis tool. There are several steps required to perform when using Scenario Manager. They are listed below:
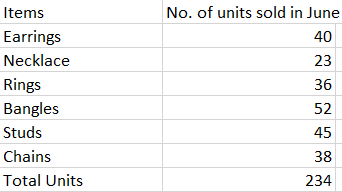
Step 1: Create a table that shows the number of units sold in the month of June and use the formula =SUM to find the sum of them.
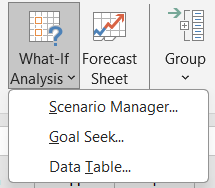
Step 2: Select the ‘Data’ option, followed by the ‘What If Analysis’ option, where a drop-down menu will appear. Next, select ‘Scenario Manager’ by clicking.
Step 3: You will now see a dialog box for creating scenarios. Click on ‘Add’

Step 4: Clicking "add" opens a dialog box to name and identify cells for scenario creation, simplifying the process.
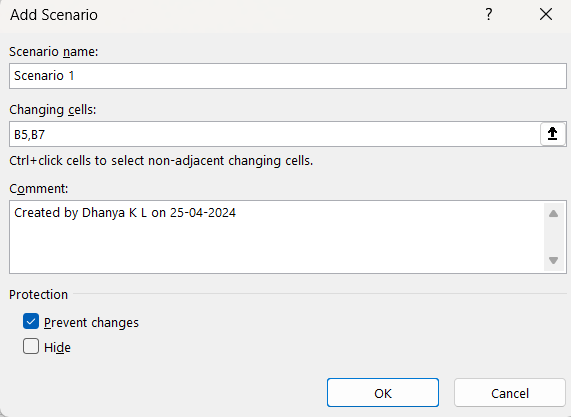
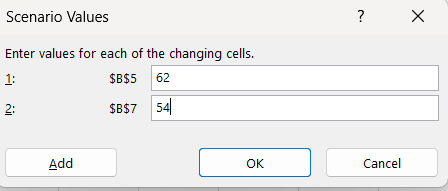
Step 5: Clicking ‘OK’ will open a window where can change the values. After changing the values, click ‘Add’. This will add the scenario to the Add scenario box.
Step 6: Then go to the ‘Add Scenario’ box to repeat steps for creating additional scenarios. After creating all desired scenarios, click the ‘Summary’ button to access the ‘Scenario Summary’ box, which offers two types of reports.
1. Scenario Summary
2. Scenario PivotTable report.

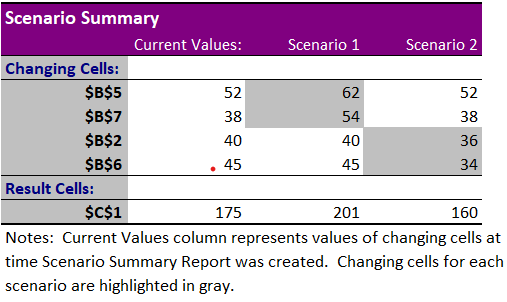
Step 7: Click on ‘OK’, and you will see the scenario summary as a separate sheet. This will allow you to compare different scenarios and find the best one.
Goal Seek
Going into goal seek, suppose you have a result in mind and want to achieve it. But you are not able to understand which input to change to which value. Under these circumstances, goal seek becomes your go-to companion. It has made its presence felt by becoming the best friend of people who deal with finance.
One of the simple yet effective tools in Excel What If analysis, which allows you to take you to your targeted goal by adjusting certain values. To clear the path to your intended target value, a formula must be added to the data.
How Do I Use Goal Seek?
Its usage can seem like a rollercoaster, but trust me when you catch the trick, you will ace it.
What If analysis goal seek in Excel can be rightly explained with the help of an example. Let’s go through it.
- Step 1: Click on Goal Seek under the What-If analysis tool.
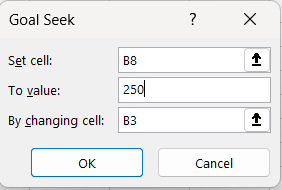
- Step 2: Clicking on "Goal seek" prompts a window where you enter details. Under the "Set cell," input the cell with the formula and desired result. In "To value," enter the desired formula result. Lastly, in the “By changing cell" box, specify the cell containing the value to adjust and reach the goal.
- Step 3: After providing the details, click ‘OK’. This will open a dialog box that displays the status of the inputs you have provided for clarity.
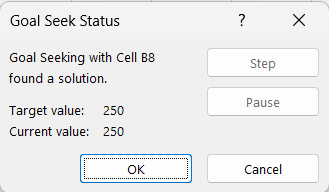
- Step 4: Again, click OK and tada! You have reached your target result in no time.
Data Table in Excel (What If analysis)
Data Table in Excel What If analysis goes through a process where the value in certain selective cells are changed to come up with answers to different questions. Data tables are great for analysing a range of possibilities quickly.
What If analysis data table is of two types: One variable data table and Two variable data table. The One variable data table is the simplest one where you get to see the final outcome as you are allowed to change one value at a time.
In a two variable data table, you are able to understand how changing two values will tweak the final outcome.
How to Use What If Analysis Data Table in Excel?
Understanding the function of a data table is essential, though not challenging. For instance, consider analyzing product sales to grasp its application.
Below is a What If analysis in Excel example.
- Step 1: Create a table that has the total amount of sales and the percent of commission received. Apply a function to find the total commission received.
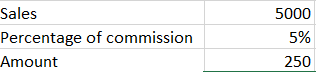
Step 2: After understanding the amount received for sales of 5000, list various input values for sales and commission percentages for substitution.

Step 3: Select the input values list and click on the data table in ‘What-If’ analysis. In the dialog box, provide the cell identification for 'Row Input cell' and 'Column Input cell' to analyze the data. If it's a one-variable data type, skip the column input cell.
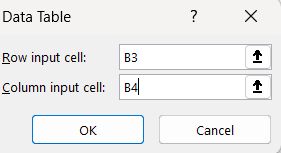
Step 4: By clicking on OK, voila! You have your data analyzed.

Wrapping It Up
Decision-making and problem-solving are two of the traits that are commonly seen everywhere. In the parallel world where Excel is dominant, the partnership of the above-mentioned traits is necessary. It is acquired by using Excel What If analysis tool. It not only makes your work easier but also provides aid to people who are still using different sheets to put different values for comparison. I have curated this tutorial with the hope that you will be able to master the What-If analysis tool and create wonders with it.
Planning to gain expertise in MS Excel? Then feel free to go through the official website of upGrad where you will come across high quality certified courses for a promising future. upGrad is ranked as one of the top platforms that are proven to provide excellent courses.
Frequently Asked Questions
- How do you use what-if analysis in Excel?
Excel What If analysis can be used by clicking on ‘Data’ on the main tab and then selecting the required type of analysis.
- How to do what-if statements in Excel?
A What-If statement can be made by clicking on the What If analysis button in the ‘Data’ tab. The required type of analysis can be chosen based on the statement.
- What is the IF then analysis in Excel?
The IF-then analysis in Excel is one of the options in which you can test a condition, clarify whether it is true or false, and then proceed with the instructions.
4. What is the purpose of a model in What-if analysis?
The primary purpose of a model in What-If analysis is to understand and register the significant input values that change the results.
5. How do you use What-If analysis in Excel Data Table?
A data table can be used in a what-if analysis by selecting it from the drop-down arrow in the ‘What-If analysis’ section. The step-by-step method for using it is discussed above.
6. How do you Analyse data from a table in Excel?
In Excel, data is analyzed by clicking the analyze data button in the main tab after selecting the cells.
7. Is Data Table a what-if analysis tool?
The data table, a tool within 'What-If analysis,' enables the substitution of original values with alternatives to observe resulting changes.
8. How do you analyze datasets in Excel?
Data sets can be analyzed by clicking on the analyze data button in the home tab.