All courses
Agentic AI
Agentic AI

IIIT Bangalore
Executive Programme in Generative AI for LeadersArtificial Intelligence
Degree / Exec. PG

IIIT Bangalore
Executive Diploma in Machine Learning and AI
OPJ Global University
Master’s Degree in Artificial Intelligence and Data Science
Liverpool John Moores University
Master of Science in Machine Learning & AI
Golden Gate University
DBA in Emerging Technologies with Concentration in Generative AIExecutive Certificate

IIITB & IIM, Udaipur
Chief Technology Officer & AI Leadership ProgrammeIIIT Bangalore
Executive Programme in Generative AI for Leaders
upGrad | Microsoft
Gen AI Foundations Certificate Program from MicrosoftupGrad | Microsoft
Gen AI Mastery Certificate for Data AnalysisupGrad | Microsoft
Gen AI Mastery Certificate for Software DevelopmentupGrad | Microsoft
Gen AI Mastery Certificate for Managerial ExcellenceOffline Bootcamps

upGrad
Data Science and AI-MLDoctorate
For All Domains
IIITB & IIM, Udaipur
Chief Technology Officer & AI Leadership Programme
Swiss School of Business and Management
Global Doctor of Business Administration from SSBM
Edgewood University
Doctorate in Business Administration by Edgewood UniversityGolden Gate University
Doctor of Business Administration From Golden Gate University
Rushford Business School
Doctor of Business Administration from Rushford Business School, SwitzerlandGolden Gate University
Master + Doctor of Business Administration (MBA+DBA)-d9bdeff6165f4eb1ba2adcebde78e961.svg)
University of Waterloo
Chief Technology and AI Officer ProgramLeadership / AI
Golden Gate University
DBA in Emerging Technologies with Concentration in Generative AIMachine Learning
Machine Learning
Data Science
Degree / Exec. PG
O.P Jindal Global University
Master’s Degree in Artificial Intelligence and Data ScienceIIIT Bangalore
Executive Diploma in Data Science & AILiverpool John Moores University
Master of Science in Data ScienceExecutive Certificate
upGrad | Microsoft
Gen AI Foundations Certificate Program from MicrosoftupGrad | Microsoft
Gen AI Mastery Certificate for Data AnalysisupGrad | Microsoft
Gen AI Mastery Certificate for Software DevelopmentupGrad | Microsoft
Gen AI Mastery Certificate for Managerial ExcellenceupGrad | Microsoft
Gen AI Mastery Certificate for Content CreationOffline Bootcamps
upGrad
Data Science and AI-MLupGrad
Data AnalyticsMBA
Masters

Paris School of Business
Master of Science in Business Management and TechnologyO.P.Jindal Global University
MBA (with Career Acceleration Program by upGrad)Edgewood University
MBA from Edgewood UniversityO.P.Jindal Global University
MBA from O.P.Jindal Global UniversityGolden Gate University
Master + Doctor of Business Administration (MBA+DBA)Executive Certificate

IMT, Ghaziabad
Advanced General Management ProgramMarketing
Executive Certificate
Offline Bootcamps
upGrad
Digital MarketingManagement
Degree
O.P Jindal Global University
MSc in International Accounting & Finance (ACCA integrated)Paris School of Business
Master of Science in Business Management and Technology
Golden Gate University
Master of Arts in Industrial-Organizational PsychologyExecutive Certificate

IIIT-B & IIM, Udaipur
Chief Technology Officer & AI Leadership Programme
IIM Kozhikode
Human Resource Analytics Course from IIM-KupGrad | Microsoft
Gen AI Foundations Certificate Program from MicrosoftEducation
Education

Northeastern University
Master of Education (M.Ed.) from Northeastern UniversityEdgewood University
Doctor of Education (Ed.D.)Edgewood University
Master of Education (M.Ed.) from Edgewood UniversityCertifications
Project Management
Certification

Knowledgehut
Leadership And Communications In ProjectsKnowledgehut
Microsoft Project 2007/2010-ae8d039bbd2a41318308f8d26b52ac8f.svg)
Knowledgehut
Financial Management For Project ManagersKnowledgehut
Fundamentals of Earned Value Management (EVM)Knowledgehut
Fundamentals of Portfolio ManagementKnowledgehut
Fundamentals of Program Management-35c169da468a4cc481c6a8505a74826d.webp&w=128&q=75)
Knowledgehut
CAPM® CertificationsKnowledgehut
Microsoft® Project 2016Certifications & Trainings
-7f4b4f34e09d42bfa73b58f4a230cffa.webp&w=128&q=75)
Knowledgehut
PMP® CertificationKnowledgehut
PMI-RMP® CertificationKnowledgehut
PMP Renewal Learning PathKnowledgehut
Oracle Primavera P6 V18.8Knowledgehut
Microsoft® Project 2013Knowledgehut
PfMP® Certification CourseKnowledgehut
Project Planning and MonitoringPrince2 Certifications

Knowledgehut
PRINCE2® FoundationKnowledgehut
PRINCE2® PractitionerKnowledgehut
PRINCE2 Agile Foundation and PractitionerKnowledgehut
PRINCE2 Agile® Foundation CertificationKnowledgehut
PRINCE2 Agile® Practitioner CertificationManagement Certifications
Knowledgehut
Project Management Masters Certification ProgramKnowledgehut
Change ManagementKnowledgehut
Project Management TechniquesKnowledgehut
Product Management Certification ProgramKnowledgehut
Project Risk Management- Study abroad
- Offline centres
- uGSOT - B.Tech
More


What is Normal Distribution?
Normal distribution is a symmetrical, bell-shaped probability distribution characterized by its mean (μ) and standard deviation (σ). It has a natural prevalence because many natural phenomena tend to follow the distribution pattern.
The normal distribution is synonymous with the Gaussian distribution and is associated with probability theory and statistics over centuries. French mathematician Abraham de Moivre made significant contributions (during the 18th century) with his work on normal approximation and binomial distribution. His work influenced the Normal Curve, with his findings laying the groundwork for later developments.
Normal Curve Distribution
The normal distribution is a continuous probability distribution symmetric around its mean (average) μ. It comprises two primary characteristics (the mean (μ) and the standard deviation (σ)), which determine the spread or dispersion of the distribution.
The curve has a distinct bell shape with its highest point at the mean. It is symmetric because the left and right tails of the curve are identical. The curve extends indefinitely in both directions but asymptotically approaches zero as it moves away from the mean.
Properties of Normal Distribution
Normal distribution exhibits several characteristics apart from primary mean and standard deviation. Below is a highlight of the other properties of the distribution concept.
- Symmetry - The normal distribution probability density function is symmetric around its mean. Folding the curve along the vertical line at the mean would cause the left and right halves to overlap perfectly.
- Unimodality - The normal distribution is unimodal, meaning it has only one peak or mode. The highest point on the curve corresponds to the mean, and the distribution tapers off symmetrically in both directions from this point.
- Mean, Median, and Mode - The mean (average), median and mode are all equal and located at the center of the distribution in a normal distribution. The symmetry of the distribution facilitates this occurrence.
- Standard Deviation - The standard deviation of a normal distribution determines the spread or dispersion of the data. It quantifies the average distance of data points from the mean. Approximately 68% of the data falls within one standard deviation of the mean, 95% within two standard deviations, and 99.7% within three standard deviations.
- Skewness and Kurtosis - The normal distribution is perfectly symmetrical and has zero skewness compared to other distributions. Skewness measures the lack of symmetry in a distribution, and since the normal distribution is symmetric, its skewness is always zero. Kurtosis measures the 'peakedness' of the distribution. The normal distribution has a kurtosis of 3 and the baseline for comparison with other distributions. It is referred to as mesokurtic to indicate a moderate peak.
Formula for Calculating Normal Distribution
The section below covers the formula for calculating normal distribution. Expect to cover the Probability Density Function (PDF), Cumulative Distribution Function (CDF), and moments/moment generating function.
1. Probability Density Function (PDF)
The probability density function of normal distribution 𝑓(𝑥) with mean 𝜇 and standard deviation
𝜎 is illustrated using the mathematical formula below.
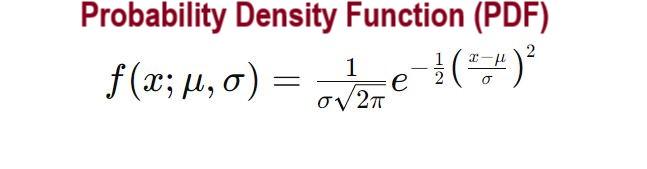
Source: Nickey Bricks
Below is a key to understanding the above formula.
- The x symbol represents the variable.
- The μ symbol in the PDF formula represents the mean of the distribution.
- The σ symbol represents the standard deviation of the distribution.
- The e symbol represents the base of the natural logarithm.
2. The Cumulative Distribution Function (CDF)
The cumulative distribution function of a normal distribution is the probability that a random variable 𝑋 with a normal distribution is less than or equal to a certain value 𝑥. Below is a mathematical representation of the cumulative distribution function.
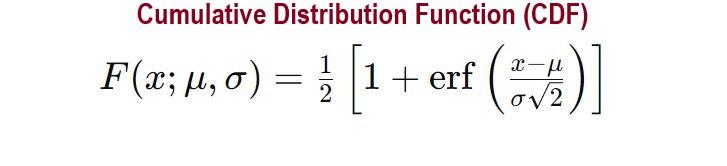
Source: Nickey Bricks
The erf symbol represents the error function in the above mathematical equation.
3. Moments and Moment Generating Function
Moments are quantitative measures related to the shape of the distribution's graph. Below are the moments for a normal distribution graph.
- First Moment (Mean) - The mean (μ) is the first moment and is represented by the E[x]=μ equation.
- Second Moment (Variance) - The variance (σ²) is the second central moment with the following equation Var(X)=σ 2.
- Third Moment (Skewness) - The skewness of a normal distribution is 0, indicating that it is symmetric about the mean with Skewness(X)=0.
- Fourth Moment (Kurtosis) - The kurtosis of a normal distribution is 3. Excess kurtosis is often considered by subtracting 3 from the kurtosis, thus Kurtosis(X)=3.
The Moment Generating Function 𝑀𝑋(𝑡) of a random variable 𝑋 is defined as the expected value of 𝑒𝑡𝑋. The Moment Generating Function of a normal distribution is represented using the mathematical formula below.
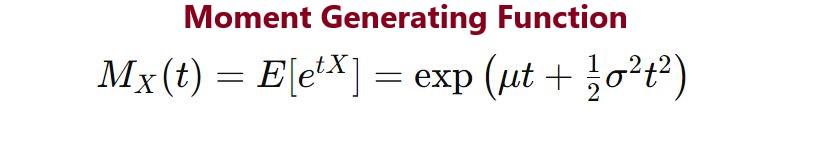
Source: Nickey Bricks
The symbol E denotes the expectation operator in the above mathematical equation.
Standard Normal Distribution
Normal distribution and standard normal distribution are sometimes used interchangeably. The standard normal distribution is a representation of the normal distribution with a mean of 0 and a standard deviation of 1. It is denoted using the Z∼N(0,1) mathematical equation. Below is a mathematical representation of the probability density function (PDF) of the standard normal distribution.
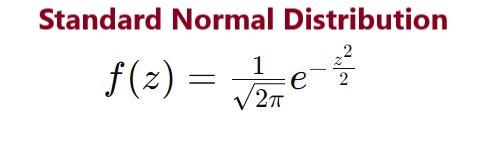
Source: Nickey Bricks
The 𝑧 symbol represents the standard normal variable in the above equation.
Z Scores
The Z/standard score illustrates how many standard deviations an element is from the mean. It is a dimensional quantity and you can use the formula below to realize its value.
z = x - μ
- The x symbol represents the value of the element.
- The symbol represents the mean of the distribution.
- The symbol represents the standard deviation of the distribution.
Z-scores allow for the comparison of scores from different distributions by converting them into a common scale.
Real-Life Example of Normal Probability Distribution
Normal distribution is applicable in various industries owing to its convenient mathematical properties and the Central Limit Theorem. The Central Limit Theorem dictates that the sum of many independent random variables tends to follow a normal distribution, regardless of the original distributions. Below are real-life applications of the normal distribution concept.
- Statistical Inference - Normal distribution is efficient statistical tests, such as t-tests, ANOVA, and regression analysis.
- Confidence Intervals - Normal distribution can construct confidence intervals for population parameters, particularly when sample sizes are large.
- Hypothesis Testing - Z-tests and t-tests utilize the properties of the normal distribution to test hypotheses about population means and proportions.
- Stock Prices and Returns - Daily stock returns often use the normal distribution to facilitate risk assessment and portfolio optimization.
- Risk Management - The Value at Risk (VaR) metric estimates the maximum potential loss in the value of portfolios.
- Six Sigma - The Six Sigma methodology uses the normal distribution to define process improvement goals and quantify the probability of defects.
- Astronomy - Measurement errors in astronomical observations often follow a normal distribution.
- Psychometrics - Scores on standardized tests (e.g., IQ tests, SATs) often follow a normal distribution to compare individuals.
Practical Considerations for Calculating Normal Distribution
You should consider the estimation of parameters, appropriate sampling methods, model selection, and the interpretation of results to get an accurate analysis/interpretation of data.
- Estimation of Parameters - Consider the Maximum Likelihood Estimation (MLE), method of moments, and Bayesian Estimation to get an accurate analysis.
- Sampling Methods - Differentiate between the random, stratified, and systematic sampling methods to identify the ideal sampling method.
- Model Selection - You can select between the Goodness-of-Fit Tests, Akaike Information Criterion (AIC), Bayesian Information Criterion (BIC), and Residual Analysis methods.
- Interpretation of Results - You can select between confidence intervals, hypothesis testing, P-values, Effect Sizes, and Assumption-Checking methods to interpret your results.
Challenges and Limitations of Normal Distribution Statistics
Normal distribution has some challenges and limitations. Here is a summary:
1. Assumptions and Validity
Data points need to be independent and come from the same distribution. The normal distribution assumes that data is symmetrically distributed around the mean and has a single peak. However, the assumptions might not hold in real life, thus leading to inaccurate results. Non-normality can affect the validity of statistical tests and confidence intervals that assume normality. The Central Limit Theorem justifies normality for large samples, but the distribution of the sample mean may not be reliable with small samples.
2. Sensitivity to Outliers
The normal distribution is sensitive to outliers. A single extreme value can significantly skew the mean and inflate the variance. You can identify outliers using methods like Z-scores. It is essential to decide whether to transform, exclude, or treat outliers differently, considering their impact on the analysis.
3. Robust Alternatives
You can use non-parametric methods like the Mann-Whitney U test, Wilcoxon signed-rank test, and Kruskal-Wallis tests to circumvent the assumption bias of normal distribution. Robust techniques like Median and Interquartile Range (IQR), Trimmed Mean, and Winsorized Mean also offer less sensitivity to outliers and violations of assumptions. You can also select the bootstrapping technique because it allows estimation of the sampling distribution of a statistic by repeatedly sampling with replacement from the data. Bootstrapping provides more accurate confidence intervals and significance tests without relying on normality assumptions.
Wrapping Up
The normal distribution, characterized by its bell-shaped curve, is defined by the mean (μ) and standard deviation (σ). It is a reliable data analysis method and is often applicable in evaluating probability, statistics, finance, economy, and quantity control in various fields.
Multivariate normal distribution methodology on the other hand, is advanced. It extends the normal distribution to multiple variables. You can use such methods to circumvent the limitations of normal distribution. The future direction of normal distribution highlights the method’s active role in AI, machine learning, complex systems, and network advancement.
FAQs
1. What is the normal distribution?
A normal distribution is a symmetrical, bell-shaped probability distribution characterized by its mean (μ) and standard deviation (σ).
2. What does the normal distribution represent?
The normal distribution, characterized by its bell-shaped curve, is defined by the mean (μ) and standard deviation (σ).
3. What are the key properties of the normal ditribution?
The properties of a normal distribution include its symmetry, bell-shaped, centered at the mean, with mean, median, mode equal, and standard deviation.
4. Why is the normal distribution important?
The normal distribution is crucial for statistical inference, hypothesis testing, and modeling natural phenomena due to its mathematical properties and prevalence.
5. How is the normal distribution characterized?
The normal distribution is characterized by its mean (μ), standard deviation (σ), bell-shaped curve, symmetry, and the 68-95-99.7 rule.
6. How to calculate normal distribution?
You can calculate normal distribution using the mathematical formula below. f(x) = 12πe-(x-μ)22σ2 f ( x ) = 12 πe - ( x - μ ) 22 σ 2
7. What is the z-score in normal distribution?
The z-score represents the number of standard deviations a data point is from the mean. You can calculate it using the mathematical equation below. z = x- μ
8. How can we use normal distribution in real life?
You can experience the normal distribution’s active role in quality control, risk management, standardized testing, natural phenomena modeling, and statistical analysis sectors.

Author|13 articles published


upGrad Learner Support
Talk to our experts. We are available 7 days a week, 10 AM to 7 PM
Indian Nationals
Foreign Nationals
Disclaimer
The above statistics depend on various factors and individual results may vary. Past performance is no guarantee of future results.
The student assumes full responsibility for all expenses associated with visas, travel, & related costs. upGrad does not .
