For working professionals
For fresh graduates
- Study abroad
More
- Post Graduate Certificate in Data Science & AI (Executive)
- Gen AI Foundations Certificate Program from Microsoft
- Gen AI Mastery Certificate for Data Analysis
- Gen AI Mastery Certificate for Software Development
- Gen AI Mastery Certificate for Managerial Excellence
- Gen AI Mastery Certificate for Content Creation
- Post Graduate Certificate in Product Management from Duke CE
- Human Resource Analytics Course from IIM-K
- Global Master Certificate in Integrated Supply Chain Management
- Gen AI Foundations Certificate Program from Microsoft
- CSM® Certification Training
- CSPO® Certification Training
- PMP® Certification Training
- SAFe® 6.0 Product Owner Product Manager (POPM) Certification
- Post Graduate Certificate in Product Management from Duke CE
- Professional Certificate Program in Cloud Computing and DevOps
- Python Programming Course
- Executive Post Graduate Programme in Software Dev. - Full Stack
- AWS Solutions Architect Training
- AWS Cloud Practitioner Essentials
- AWS Technical Essentials
- The U & AI GenAI Certificate Program from Microsoft
1. Introduction
6. PyTorch
9. AI Tutorial
10. Airflow Tutorial
11. Android Studio
12. Android Tutorial
13. Animation CSS
16. Apex Tutorial
17. App Tutorial
18. Appium Tutorial
21. Armstrong Number
22. ASP Full Form
23. AutoCAD Tutorial
27. Belady's Anomaly
30. Bipartite Graph
35. Button CSS
39. Cobol Tutorial
46. CSS Border
47. CSS Colors
48. CSS Flexbox
49. CSS Float
51. CSS Full Form
52. CSS Gradient
53. CSS Margin
54. CSS nth Child
55. CSS Syntax
56. CSS Tables
57. CSS Tricks
58. CSS Variables
61. Dart Tutorial
63. DCL
65. DES Algorithm
83. Dot Net Tutorial
86. ES6 Tutorial
91. Flutter Basics
92. Flutter Tutorial
95. Golang Tutorial
96. Graphql Tutorial
100. Hive Tutorial
103. Install Bootstrap
107. Install SASS
109. IPv 4 address
110. JCL Programming
111. JQ Tutorial
112. JSON Tutorial
113. JSP Tutorial
114. Junit Tutorial
115. Kadanes Algorithm
116. Kafka Tutorial
117. Knapsack Problem
118. Kth Smallest Element
119. Laravel Tutorial
122. Linear Gradient CSS
129. Memory Hierarchy
133. Mockito tutorial
134. Modem vs Router
135. Mulesoft Tutorial
136. Network Devices
138. Next JS Tutorial
139. Nginx Tutorial
141. Octal to Decimal
142. OLAP Operations
143. Opacity CSS
144. OSI Model
145. CSS Overflow
146. Padding in CSS
148. Perl scripting
149. Phases of Compiler
150. Placeholder CSS
153. Powershell Tutorial
158. Pyspark Tutorial
161. Quality of Service
162. R Language Tutorial
164. RabbitMQ Tutorial
165. Redis Tutorial
166. Redux in React
167. Regex Tutorial
170. Routing Protocols
171. Ruby On Rails
172. Ruby tutorial
173. Scala Tutorial
175. Shadow CSS
178. Snowflake Tutorial
179. Socket Programming
180. Solidity Tutorial
181. SonarQube in Java
182. Spark Tutorial
189. TCP 3 Way Handshake
190. TensorFlow Tutorial
191. Threaded Binary Tree
196. Types of Queue
197. TypeScript Tutorial
198. UDP Protocol
202. Verilog Tutorial
204. Void Pointer
205. Vue JS Tutorial
206. Weak Entity Set
207. What is Bandwidth?
208. What is Big Data
209. Checksum
211. What is Ethernet
214. What is ROM?
216. WPF Tutorial
217. Wireshark Tutorial
218. XML Tutorial
R Programming Tutorial
Introduction
In the realm of statistical analysis, data visualization, and scientific computing, R emerges as a robust open-source programming language and environment. It is supported by the R Foundation for Statistical Computing and a large community of contributors. R language’s popularity has soared, captivating statisticians, data analysts, researchers, and marketers who seek to gather, analyze, and visualize data effectively.
Throughout this all-encompassing R programming tutorial, we delve into the fundamentals of R, tracing its historical roots, highlighting its distinctive features, and drawing comparisons with Python. Moreover, we venture into diverse applications, supplementing the exploration with illustrative R programming examples to facilitate a clearer grasp for beginners.
Overview
This R programming tutorial details the origin and evolution of the R language. Since its creation, it has become the lingua franca of Data Science and Statistics. Here are some of the key highlights of R programming:
- It is commonly used for developing statistical software and analyzing data. It provides a wide variety of statistical functions.
- R has effective data handling and storage capabilities. It offers numerous data manipulation tools.
- R supports statistical techniques like linear and nonlinear modeling, time series analysis, classification, clustering, etc.
- R is designed for data visualization and also offers outstanding graphics capabilities like plotting, charting, mapping, etc.
- R is extensible through packages. There are over 16k packages available on CRAN (Comprehensive R Archive Network).
- R can also integrate with other languages like C, C++, Java, and Python. It is a versatile language; you can use an R language compiler to compile R code efficiently.
- R is cross-platform. It is available for Linux, Windows, and macOS.
History of R Programming
The roots of R date back to the early 90s. It started as a side project by Ross Ihaka and Robert Gentleman at the University of Auckland, New Zealand. They wanted to develop a programming language that could be used for statistical analysis in a UNIX environment.
- In 1993, work on the R project commenced. Next year in 1994, Martin Maechler joined Ihaka and Gentleman to work on the commercialization of R code. It was initially written in C and Fortran.
- The first official version, 0.49 of R, was released in 1995. Later in 1996, the R Core Group was formed to develop further and maintain R.
- In 1997, the first mailing list for R was created to discuss issues related to R. The Comprehensive R Archive Network (CRAN) was also established to host R packages.
- The first official stable version, 1.0.0 of R, was released in 2000. In the following years, R gained popularity in the Data Science community.
- R Foundation was formed to support the R project and community in 2008.
R has been evolving with new features, capabilities, packages, and tools. It has become the leading programming language for statistical computing and graphics.
What is R Programming?
R, a freely available programming language, is widely utilized as statistical software and a potent tool for data analysis.
Some Key Aspects of R Programming
- R executes commands directly without needing to compile program codes, hence called interpreted.
- It allows you to type commands and see the results directly. It also supports GUIs.
- R includes object-oriented features like classes, inheritance, and polymorphism.
- It supports multidimensional data structures like vectors, matrices, arrays, and data frames to store data, thus called as multivariate.
- R has functional programming capabilities since it provides many common functional programming idioms.
- The functionality of base R can be extended through user-created packages and is thus extensible.
- R provides various high-level data manipulation tools.
- R allows writing functions, conditional statements, loops, etc. Thus, it is a procedural programming language.
- R has dedicated tools for data mining, modeling, visualization, etc.
R allows to efficiently perform statistical analysis on big datasets. Users can load datasets, run statistical tests, create charts/plots, train machine learning models, produce reports, etc., using R scripts, functions, and packages.
Features of R Programming
Here are some of the salient features that make R a popular choice among Data Scientists.
1. Effective Data Handling
- It supports data import from files, databases, web URLs, other statistical systems, etc.
- R offers data-wrangling functions for cleansing, transforming, and aggregating data.
- Missing values and NaN values can be handled using R commands.
2. Statistical Analysis & Modeling
- R has a comprehensive collection of tools for descriptive statistics like mean, median, correlation, regression, etc.
- It supports hypothesis testing methods, including t-test, chi-square, ANOVA, covariance, etc.
- R provides modeling techniques like linear models, generalized linear models, neural networks, decision trees, random forests, etc.
3. Data Visualization
- R natively supports data visualization through built-in graphics and plotting functions.
- It offers various graphs like histograms, scatter plots, box plots, dot charts, maps, networks, etc.
- Visual customization is possible through parameters like shape, color, size, background, etc.
- Additional visualization packages are available for advanced graphs.
4. Programming Constructs
- R has control flow statements like if-else, for loop, while loop, repeat loop, break, next, etc.
- It supports user-defined recursive functions with arguments and return values.
- R allows vectorization, that is, operations on entire columns without writing loops.
- Users can write custom R packages using R's package development tools.
5. Debugging Support
- debug() can set breakpoints in a function to pause execution and check variable values.
- R also provides tools like traceback(), browser(), and recover() for debugging.
- Logical operators are useful for debugging conditional code.
6. Cross-platform:
- R provides pre-built binaries for various platforms like Windows, Linux, and macOS.
- CRAN hosts about 16000 R packages that work across platforms.
- RGui provides a simple frontend GUI available across platforms.
- Integrated development environments like RStudio provide cross-platform IDEs.
Example
Code:
# Effective Data Handling
# Point 1: Loading and Inspecting Data
# Sample data: A data frame with columns "Age" and "Income"
sample_data <- data.frame(
Age = c(25, 30, 40, 35, 28, 45),
Income = c(50000, 60000, 75000, 80000, 55000, 90000)
)
# Statistical Analysis & Modelling
# Point 2: Descriptive Statistics
# Calculate mean and standard deviation of the "Income" column
mean_income <- mean(sample_data$Income)
sd_income <- sd(sample_data$Income)
# Print the results
cat("Mean Income:", mean_income, "\n")
cat("Standard Deviation of Income:", sd_income, "\n")
# Point 3: Simple Linear Regression
# Let's fit a linear model to predict "Income" based on "Age"
linear_model <- lm(Income ~ Age, data = sample_data)
# Print the model summary
cat("Linear Model Summary:\n")
summary(linear_model)
# Data Visualization
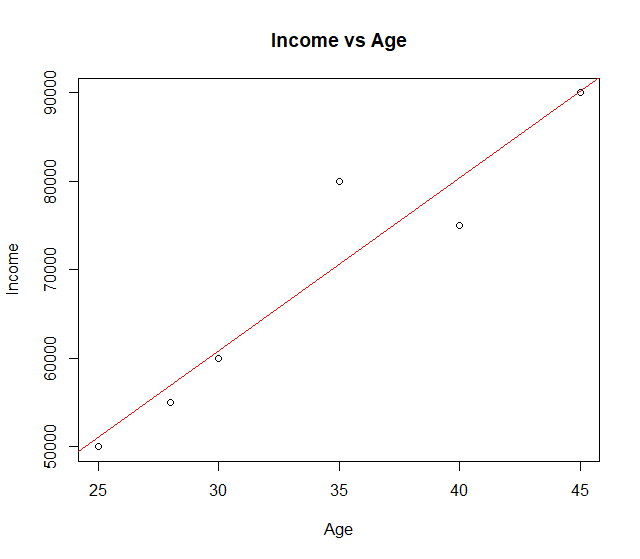
# Point 4: Scatter Plot
# Plotting the "Income" against "Age" with a regression line
plot(sample_data$Age, sample_data$Income, main = "Income vs Age", xlab = "Age", ylab = "Income")
abline(linear_model, col = "red") # Adding the regression line
# Programming Constructs
# Point 5: For Loop
# Let's create a for loop to print the squares of numbers from 1 to 5
cat("Squares of numbers from 1 to 5:\n")
for (i in 1:5) {
square <- i^2
cat(square, "\n")
}
# Point 6: If-Else Statement
# Checking if the mean income is above a certain threshold and printing a message accordingly
threshold <- 70000
if (mean_income > threshold) {
cat("Mean income is above", threshold, "\n")
} else {
cat("Mean income is below or equal to", threshold, "\n")
}
Output:
Explanation
The code first loads some sample data into a data frame called sample_data. It has two columns - Age and Income.
It then does some basic statistical analysis of this data:
- Calculates the mean and standard deviation of the Income column using mean() and sd() functions.
- Prints out the results using cat()
It fits a simple linear regression model to predict Income based on Age using the lm() function. The model summary is printed out using summary(). It also makes a scatter plot of Income vs Age with a regression line to visualize the relationship.
Some examples of programming constructs are:
- A for loop to print squares of numbers from 1 to 5
- An if-else statement to check if mean income is above a threshold and print the appropriate message
The code covers:
- Data loading and inspection
- Descriptive statistics
- Simple linear modeling
- Data visualization
- Programming building blocks like loops and conditionals
Comparison Between R and Python
Many Data Scientists use R and Python languages in tandem. Here is a comparison of the two based on some key factors.
Basis | R | Python |
Type | Statistical programming language focused on data analysis and graphics | General-purpose programming language |
Data Structures | Advanced data structures designed for data analysis like vectors, matrices, data frames, etc. | Data structures like lists, tuples, dicts are not optimized for analysis |
Data Visualization | Powerful built-in data visualization capabilities and numerous graphing libraries available via packages | Limited visualization capabilities in base Python, good external libraries like Matplotlib, Seaborn, Plotly |
Statistical capabilities | Rich library of statistical routines available in base R and packages | Statistical analysis requires importing external libraries like NumPy, SciPy, and StatsModels |
Programming Paradigm | Supports object-oriented, procedural, and functional programming | Supports object-oriented, procedural, and functional programming |
Learning Curve | The steep learning curve as R has unique programming constructs and syntax | Easy to learn for beginners with simple syntax and constructs |
Packages | More than 16000 packages available on CRAN | Large collection of packages for data science available in PyPI |
Application areas | Data analysis, statistical modeling, data mining, forecasting, bioinformatics, finance | Web development, GUI development, game development, system automation, data analysis, ML, etc. |
Performance | Fast execution of vector and matrix operations | Overall better performance than R |
Industry adoption | Heavily used in academia, research, data analytics and statistics | Wide adoption in companies and startups across all domains |
Applications of R Programming
Some of the key areas where R programming is extensively used are:
Statistical Analysis
R is used to analyze large datasets with statistical techniques like hypothesis testing, regression, multivariate analysis, time series analysis, etc.
Data Mining
R provides data mining packages for association rules, clustering, classification, recommendation systems, etc.
Machine Learning
R offers machine learning algorithms for regression, classification, decision trees, random forests, gradient boosting, neural networks, etc.
Bioinformatics
R is used in bioinformatics for genomic data analysis, phylogenetics, evolutionary biology, and drug discovery.
Finance
R is used for trading, risk analysis, modeling, forecasting, algorithmic trading, and visualization of financial data.
Marketing Analytics
R helps marketers in customer segmentation, campaign analysis, churn analysis, A/B testing, market mix modeling etc.
Business Intelligence
R creates interactive BI dashboards for data storytelling with performance indicators, forecasts, trends, and visual analytics.
Academia and Research
R is extensively used in academic disciplines dealing with data, like Statistics, Mathematics, Social Sciences, Physics, Finance, genomics, etc.
Conclusion
This R programming tutorial covers the key aspects of R. This language has been established as the standard tool for statistical computing and data visualization in Data Science, Machine Learning, and research. An R studio tutorial is also provided to help you get started with R.
For beginners, starting learning R basics with an R programming online compiler that provides hands-on exercises is recommended. Knowledge of R programming and machine learning algorithms can make you an efficient Data Analyst or Scientist.
FAQs
1. What are the benefits of learning R programming?
Some benefits of learning R are:
- It's an in-demand skill for Data Science jobs
- Has rich packages for specialized tasks
- Versatile tool for Machine Learning and predictive modeling
- Complements other data tools like Python, SQL, Hadoop.
2. Is R better than Python for Data Science?
Both R and Python are equally useful for Data Science. The former may have an edge for statistical modeling and data visualization, while the latter is more general in purpose.
3. What skills are required to learn R?
Having a statistical and mathematical background aids in better grasping R concepts. Knowledge of data handling, databases, and analytics is useful.
4. What are the different IDEs available for R?
There are several IDEs available for R. Some popular ones include RStudio, Jupyter Notebook, Eclipse + StatET, Vim-R-plugin, Emacs + ESS, Visual Studio + R Tools, R Tools for Visual Studio (RTVS), etc.

Author


upGrad Learner Support
Talk to our experts. We are available 7 days a week, 9 AM to 12 AM (midnight)
Indian Nationals
1800 210 2020
Foreign Nationals
+918068792934
Disclaimer
1.The above statistics depend on various factors and individual results may vary. Past performance is no guarantee of future results.
2.The student assumes full responsibility for all expenses associated with visas, travel, & related costs. upGrad does not provide any a.