All courses
Agentic AI
Agentic AI

IIIT Bangalore
Executive Programme in Generative AI for LeadersArtificial Intelligence
Degree / Exec. PG

IIIT Bangalore
Executive Diploma in Machine Learning and AI
OPJ Global University
Master’s Degree in Artificial Intelligence and Data Science
Liverpool John Moores University
Master of Science in Machine Learning & AI
Golden Gate University
DBA in Emerging Technologies with Concentration in Generative AIExecutive Certificate

IIITB & IIM, Udaipur
Chief Technology Officer & AI Leadership ProgrammeIIIT Bangalore
Executive Programme in Generative AI for Leaders
upGrad | Microsoft
Gen AI Foundations Certificate Program from MicrosoftupGrad | Microsoft
Gen AI Mastery Certificate for Data AnalysisupGrad | Microsoft
Gen AI Mastery Certificate for Software DevelopmentupGrad | Microsoft
Gen AI Mastery Certificate for Managerial ExcellenceOffline Bootcamps

upGrad
Data Science and AI-MLDoctorate
For All Domains
IIITB & IIM, Udaipur
Chief Technology Officer & AI Leadership Programme
Swiss School of Business and Management
Global Doctor of Business Administration from SSBM
Edgewood University
Doctorate in Business Administration by Edgewood UniversityGolden Gate University
Doctor of Business Administration From Golden Gate University
Rushford Business School
Doctor of Business Administration from Rushford Business School, SwitzerlandGolden Gate University
Master + Doctor of Business Administration (MBA+DBA)-d9bdeff6165f4eb1ba2adcebde78e961.svg)
University of Waterloo
Chief Technology and AI Officer ProgramLeadership / AI
Golden Gate University
DBA in Emerging Technologies with Concentration in Generative AIMachine Learning
Machine Learning
Data Science
Degree / Exec. PG
O.P Jindal Global University
Master’s Degree in Artificial Intelligence and Data ScienceIIIT Bangalore
Executive Diploma in Data Science & AILiverpool John Moores University
Master of Science in Data ScienceExecutive Certificate
upGrad | Microsoft
Gen AI Foundations Certificate Program from MicrosoftupGrad | Microsoft
Gen AI Mastery Certificate for Data AnalysisupGrad | Microsoft
Gen AI Mastery Certificate for Software DevelopmentupGrad | Microsoft
Gen AI Mastery Certificate for Managerial ExcellenceupGrad | Microsoft
Gen AI Mastery Certificate for Content CreationOffline Bootcamps
upGrad
Data Science and AI-MLupGrad
Data AnalyticsMBA
Masters

Paris School of Business
Master of Science in Business Management and TechnologyO.P.Jindal Global University
MBA (with Career Acceleration Program by upGrad)Edgewood University
MBA from Edgewood UniversityO.P.Jindal Global University
MBA from O.P.Jindal Global UniversityGolden Gate University
Master + Doctor of Business Administration (MBA+DBA)Executive Certificate

IMT, Ghaziabad
Advanced General Management ProgramMarketing
Executive Certificate
Offline Bootcamps
upGrad
Digital MarketingManagement
Degree
O.P Jindal Global University
MSc in International Accounting & Finance (ACCA integrated)Paris School of Business
Master of Science in Business Management and Technology
Golden Gate University
Master of Arts in Industrial-Organizational PsychologyExecutive Certificate

IIIT-B & IIM, Udaipur
Chief Technology Officer & AI Leadership Programme
IIM Kozhikode
Human Resource Analytics Course from IIM-KupGrad | Microsoft
Gen AI Foundations Certificate Program from MicrosoftEducation
Education

Northeastern University
Master of Education (M.Ed.) from Northeastern UniversityEdgewood University
Doctor of Education (Ed.D.)Edgewood University
Master of Education (M.Ed.) from Edgewood UniversityCertifications
Project Management
Certification

Knowledgehut
Leadership And Communications In ProjectsKnowledgehut
Microsoft Project 2007/2010-ae8d039bbd2a41318308f8d26b52ac8f.svg)
Knowledgehut
Financial Management For Project ManagersKnowledgehut
Fundamentals of Earned Value Management (EVM)Knowledgehut
Fundamentals of Portfolio ManagementKnowledgehut
Fundamentals of Program Management-35c169da468a4cc481c6a8505a74826d.webp&w=128&q=75)
Knowledgehut
CAPM® CertificationsKnowledgehut
Microsoft® Project 2016Certifications & Trainings
-7f4b4f34e09d42bfa73b58f4a230cffa.webp&w=128&q=75)
Knowledgehut
PMP® CertificationKnowledgehut
PMI-RMP® CertificationKnowledgehut
PMP Renewal Learning PathKnowledgehut
Oracle Primavera P6 V18.8Knowledgehut
Microsoft® Project 2013Knowledgehut
PfMP® Certification CourseKnowledgehut
Project Planning and MonitoringPrince2 Certifications

Knowledgehut
PRINCE2® FoundationKnowledgehut
PRINCE2® PractitionerKnowledgehut
PRINCE2 Agile Foundation and PractitionerKnowledgehut
PRINCE2 Agile® Foundation CertificationKnowledgehut
PRINCE2 Agile® Practitioner CertificationManagement Certifications
Knowledgehut
Project Management Masters Certification ProgramKnowledgehut
Change ManagementKnowledgehut
Project Management TechniquesKnowledgehut
Product Management Certification ProgramKnowledgehut
Project Risk Management- Study abroad
- Offline centres
- uGSOT - B.Tech
More


1. SQL Tutorial
3. SQL Commands
5. SQL Aliases
10. SQL WHERE Clause
11. SQL AND Operator
13. SQL Like
16. MySQL Workbench
22. Index in SQL
24. Schema in SQL
31. SQL ORDER BY
38. NVL in SQL
41. SQL Wildcards
45. GROUP BY in SQL
46. SQL HAVING
47. EXISTS in SQL
48. SQL Joins
53. Self Join SQL
54. Left Join in SQL
57. Cursor in SQL
58. Triggers In SQL
61. REPLACE in SQL
63. Transact-SQL
64. INSTR in SQL
70. Advanced SQL
71. SQL Subquery
78. MySQL database
79. What is SQLite
80. SQLite
Entity Relationship Diagram (ERD) - A Complete Overview
Introduction
Entity Relationship Diagrams, or ERDs, are essential tools for organizing and displaying the relationships between various database entities in the field of database management. ER diagrams are an essential tool that may be used for anything from designing the database design to facilitating stakeholder engagement. Let's look closer at ERDs, examining their importance, constituent parts, and real-world uses.
Overview
Entity Relationship Model in DBMS, commonly referred to as ER diagrams, provides a graphical representation of the logical structure of a database. They depict the entities (or tables), attributes (or columns), and the relationships between these entities. ERDs help to improve comprehension of the database schema and its underlying architecture by showing the relationships between different data elements.
What are Entity Relationship Diagrams?
An Entity Relationship (ER) Diagram is a kind of flowchart that shows the relationships between—people, things, or concepts—in a system. In the domains of software engineering, business information systems, education, and research, relational database design and debugging are the most common uses of ER Diagrams. ERD’s, often called Entity Relationship Diagrams or ER Models, illustrate the interconnection of entities, relationships, and their qualities using a predetermined set of symbols, including rectangles, ovals, diamonds, and connecting lines. With entities acting as nouns and relationships acting as verbs, they mimic the grammatical structure.
Why Do We Use ER Diagrams?
ER diagrams in SQL are very important. But there are several reasons that make the ER diagrams integral:
- ER Models in DBMS don't require any hardware support or technical expertise.
- The E-R paradigm is represented in databases by ER diagrams, which facilitate its conversion into relations (tables).
- It provides a conventional method for logically viewing the data.
- ERDs are quite helpful since they provide the function of modeling items in the real world.
- Even for a novice user, creating and understanding these diagrams is simple.
Types of ERD
There are several types of ERDs, each serving a specific purpose. Some of them are listed below:
1. Conceptual ERD
This type of ERD represents the high-level view of the database schema, focusing on entities, attributes, and their relationships without delving into implementation details.
2. Logical ERD
Logical ERDs provide a detailed representation of the database schema, including primary and foreign keys, but excluding implementation-specific details such as data types and constraints.
3. Physical ERD
Physical ERDs depict the physical implementation of the database schema, including data types, constraints, and storage details.
Symbols Used in ER Model
The logical view of the system from a data perspective, represented by the following ER diagram symbols, is modeled using the ER Model:
Figures | Symbols | Representations |
Rectangle | Rectangles are used to symbolize entities. An entity is a thing or idea that you wish to have data about stored. | |
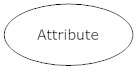
Ellipse | Attributes are symbolized by ovals. The entity's distinctive quality is one of its essential characteristics. An employee's social security number, for instance, maybe their most important characteristic. | |
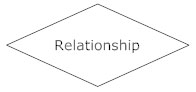
Diamond | Relationships, symbolized by diamond shapes, illustrate the information sharing between two database entities. Entities may occasionally be self-linked. | |
Double-Ellipse | Multiple values are possible for a multivalued attribute. An employee object, for instance, may have more than one skill value. An attribute's foundation is another attribute. For instance, a worker's monthly pay is determined by their yearly compensation. | |
Double Rectangle | An entity is considered weak if it cannot be uniquely identified by its properties and need to be specified by a foreign key relationship with another object. |
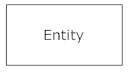


- Rectangles: In the ER Model, rectangles stand for entities.
- Ellipses: In the ER Model, ellipses stand in for attributes.
- Diamond: Relationships between Entities are represented by diamonds.
- Double Ellipse: Multi-valued attributes are represented by double ellipses.
- Double Rectangle: This shape stands for a Weak Entity.
Components of ER Diagrams
Relationships between entities in a database system, their attributes, and the entities themselves make up the ER Model.
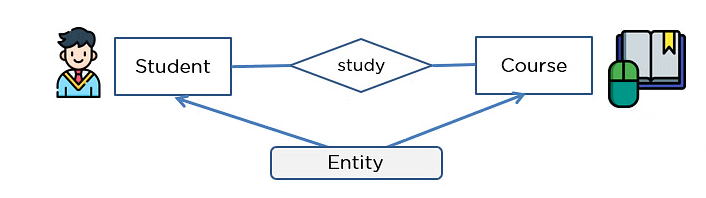
1. Entity
An entity might be a component that is living or nonliving. It displays an entity in an ERD as a rectangle. In a student study course, for instance, the student and the course are two separate things.
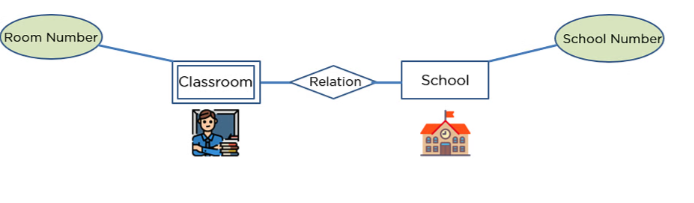
i) Weak Entity
Weak entities are those that depend on other weaker entities. In the ER Diagram, the weak entity is displayed as a double rectangle.
Because school number is its primary key attribute, it is a strong entity, as shown in the example below. In contrast to a school, this classroom is a weak entity since it lacks a primary key, and the room number serves merely as a discriminant.
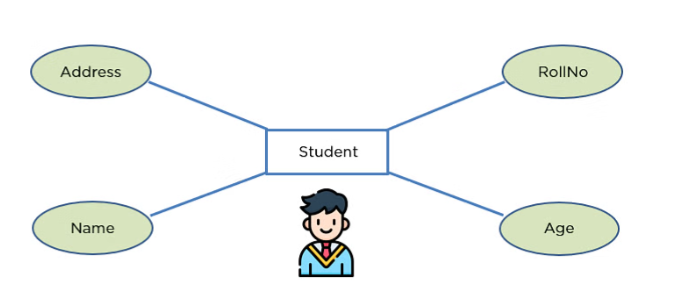
2. Attribute
An entity's properties are displayed using an attribute. In an ERD, an oval shape can be used to represent an attribute.
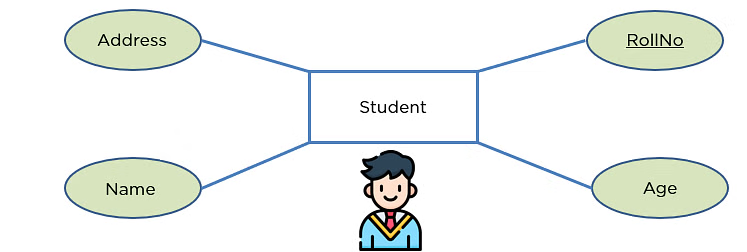
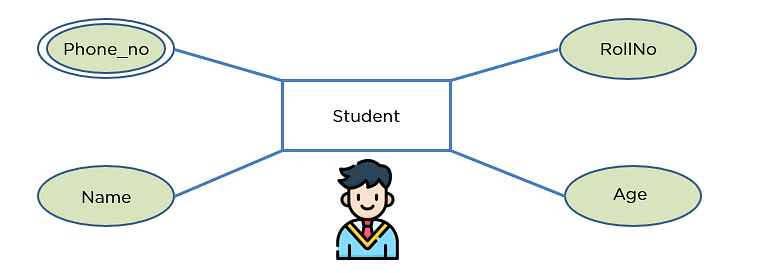
ii) Key Attribute
An entity from an entity set can be uniquely identified by its key attribute. It highlights a crucial attribute's text.
As an illustration, a student entity's roll number allows it to distinguish one individual student from a group of students.
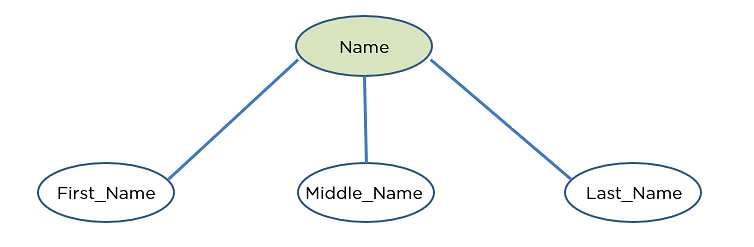
iii) Composite Attribute
A composite characteristic is one, that is made up of multiple other attributes. The composite attribute is exhibited by an oval, and this oval is further related to other ovals.
iv) Multivalued Attribute
We refer to certain qualities that have more than one value as multivalued attributes. A multivalued attribute is represented by the double oval form.
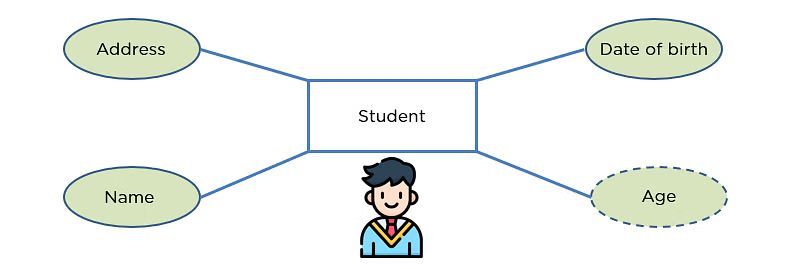
v) Derived Attribute
A derived attribute is one that may be obtained from the entity's other attributes. Age dashed oval in the ERD in DBMS stands for the derived attribute.
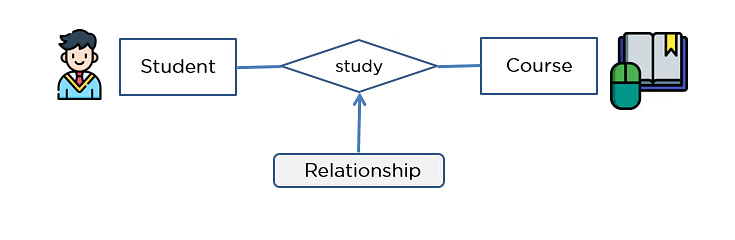
3. Relationship
In the ER diagram, a relationship is highlighted by the diamond form. It illustrates the connection between two things.
In the following example, the study is the relationship between the student and the course, which are both things.
I) One-to-One Relationship
A one-to-one relationship exists when one entity's single element is connected to another entity's single element. For instance, each student is issued a single identity card, which is the only one they have.

ii) One-to-Many Relationship
A one-to-many relationship exists when one element of one entity is connected to multiple elements of another entity. For instance, a consumer may place multiple orders, but multiple customers may not place the same order.

iii) Many-to-One Relationship
A relationship is referred to as many-to-one when more than one element of one entity is connected to a single element of another entity. For instance, although a course may have multiple students enrolled, individuals are only required to choose one.

iv) Many-to-Many Relationship
A many-to-many relationship exists when more than one element of one entity is connected to more than one element of another entity. For instance, a person may be assigned to multiple projects, and multiple people may be involved in a project.

Participation Constraint
The entity taking part in the relationship set is subject to the Participation Constraint.
1. Total Participation:
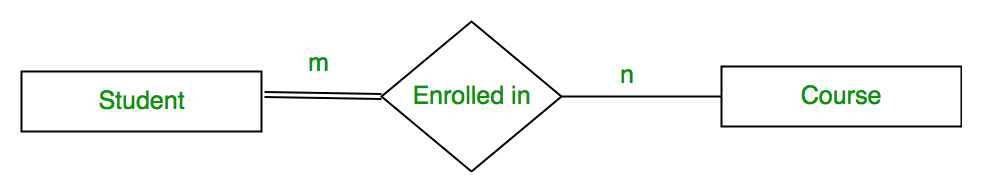
The relationship requires participation from every entity in the entity collection. Students will participate fully if they are required to enroll in a course. The ER diagram displays a double line for total involvement.
2. Partial Participation:
There is no guarantee that an entity in the entity set will take part in the relationship. A student's participation in a course will be partial if they are not enrolled in it.
The 'Enrolled in' relationship set is shown in the diagram, where the Student Entity set has full involvement, and the Course Entity set has partial participation.
A set can be used to depict it as,
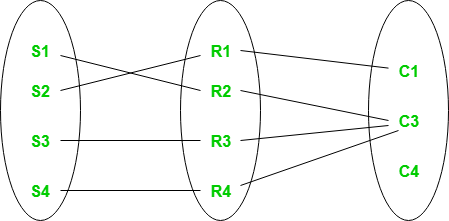
Although every student in the Student Entity set is involved in a relationship, course C4 is the only one that is not involved.
How to Sketch a Simple ER Diagram?
Don't worry if you're having trouble starting to draw an ERD. We will provide you with some ERD advice in this part. If you want to learn how to draw an ERD properly, try to follow the methods listed below.
- Make sure you understand why you are creating the ERD. Are you attempting to introduce a comprehensive system design that includes a definition of a business object? Or are you working on an ER model that is prepared for database development? To create an ERD with the appropriate amount of detail, you must be clear about your goals.
- Make sure you understand the breadth of the model. Understanding the modeling scope helps you avoid designing with unnecessary relationships and entities.
- Sketch the main participants in the scope.
- Add columns to define an entity's properties.
- Examine the ERD closely to make sure there are enough entities and columns to hold the system's data. If not, think about including more columns and entities. In this stage, you can often identify a few transactional, operational, and event entities.
- Think about the connections between each entity and establish appropriate cardinality between them (e.g., a one-to-many relationship between the entities Customer and Order). If there are orphan entities, don't be alarmed. It's legitimate even though it's not frequent.
- Restructure the entities using the database normalization technique to lessen data redundancy and enhance data integrity. For instance, the manufacturer's information may have originally been saved under the Product entity. If you discover that detail repeats itself record after record throughout the normalization process, you can divide it into a distinct entity called Manufacturer and use a foreign key to establish a connection between manufacturer and product.
ER Diagram Tips and Tricks
Creating effective ERDs is very important for structuring a database. Following are some tips and tricks to help you create meaningful ERDs-
- Indicate the degree of specificity required for your objective. Depending on how much information is required, you could choose to draw a conceptual, logical, or physical model.
- Be aware of linkages or entities that are redundant.
- When debugging a database issue, keep an eye out for missing entities or attributes or gaps in relationships.
- Ensure that you have labels for each of your entities and relationships.
- If translating relational tables and ERD back and forth aids in your goal-achieving, then you can do that.
- Verify that the ERD can accommodate all of the data that has to be kept.
- An ERD may be approached in a variety of legitimate ways. It's good as long as it offers the details required for its scope and goal.
ER Diagram Examples
An ERD (Entity relationship diagram) is used to visualize the relationship between entities. Here are some examples-
1. Library Management System
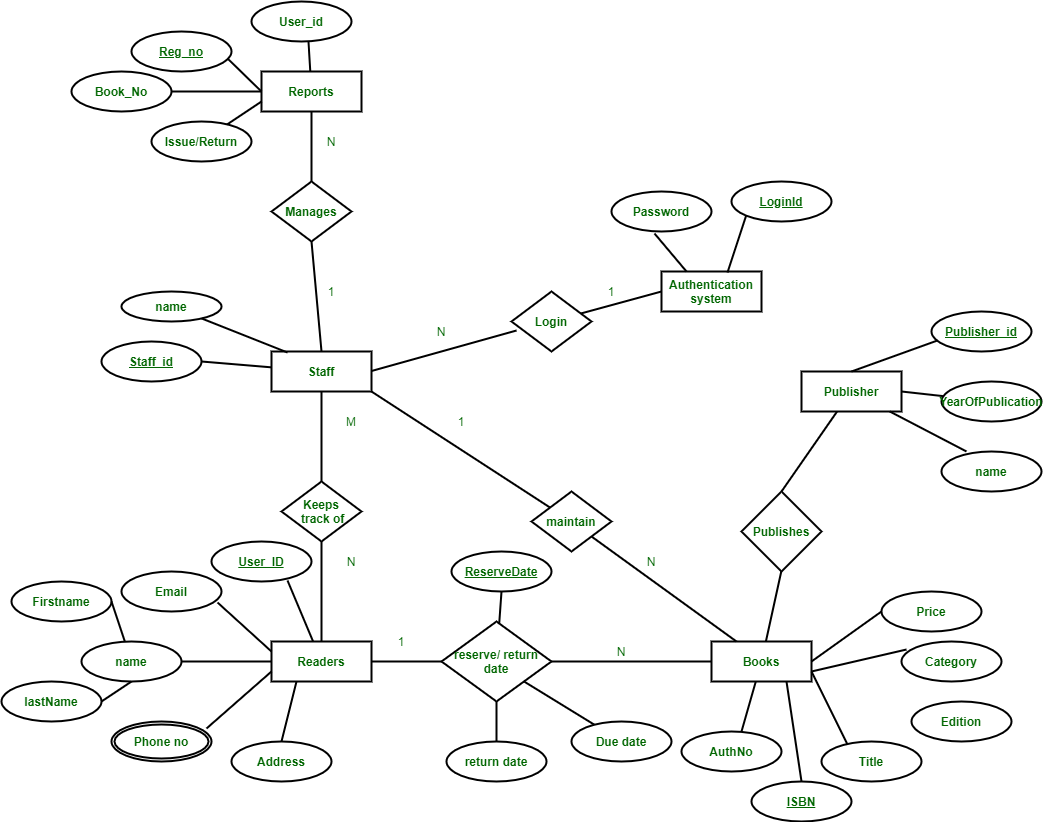
This ERD represents a library management system. Entities include Book (title, author, ISBN), Member (member ID, name, contact information), and Loan (loan ID, book ID, member ID, due date). The relationships show that a book can be loaned to one member at a time, and a member can borrow multiple books.
2. Online Course Enrollment
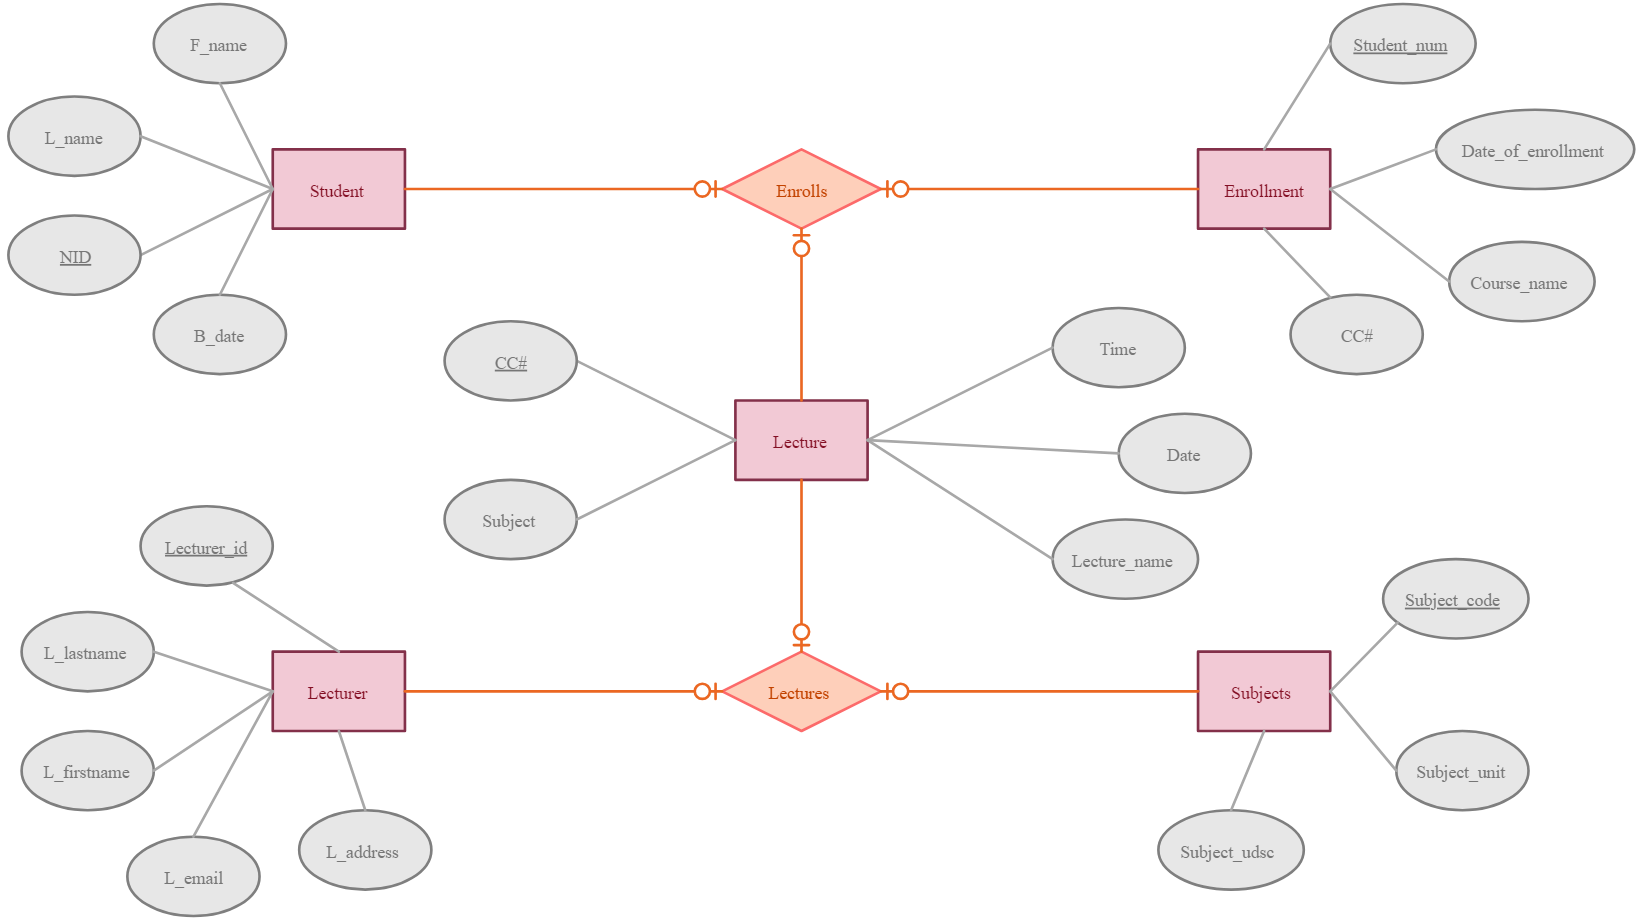
This ER D depicts an online course enrollment system. Entities include Course (course ID, title, description), Student (student ID, name, email), and Enrollment (enrollment ID, course ID, student ID, grade). The relationships illustrate that a student can enroll in multiple courses, and a course can have multiple enrolled students.
Conclusion
Entity Relationship Diagrams (ERDs) serve as a fundamental tool in database management systems, providing a visual representation of the logical structure and relationships within a database. By facilitating database design, communication, and normalization, ERDs play a crucial role in ensuring the efficiency and integrity of databases. Understanding the components, types, and best practices associated with ERDs is essential for database designers and developers in creating robust and scalable database systems.
Frequently Asked Questions
1. How to create an ERD in SQL?
To create an ERD in SQL, first, identify entities, attributes, and relationships. Then, use SQL commands like CREATE TABLE to define tables and their relationships in the database schema.
2. Why is the ER diagram used?
ER diagrams are used to visually represent the logical structure of a database, including entities, attributes, and relationships. They aid in database design, communication, and normalization, ensuring efficient and organized data management.
3. How to read ERD SQL?
To read an ERD in SQL, understand the tables (entities), columns (attributes), and relationships between tables. Attention to primary and foreign keys to comprehend how data is structured and linked in the database.
4. How to create a table diagram in an SQL server?
In SQL Server Management Studio (SSMS), you can create a table diagram by accessing the "Database Diagrams" folder, right-clicking, and selecting "New Database Diagram." Then, add tables from your database and define relationships between them.
5. What is the best ERD tool for SQL?
Some popular ERD tools for SQL include Microsoft Visio, Lucidchart, dbForge Studio, and MySQL Workbench. Choose based on your specific requirements and preferences.
6. What are ER diagram symbols?
ER diagram symbols represent different components like entities, attributes, and relationships. Common symbols include rectangles for entities, ovals for attributes, and diamonds for relationships.
7. What is the full form of ERD?
The full form of ERD is the Entity Relationship Diagram.
8. Are ER diagrams important in SQL?
Yes, ER diagrams are crucial in SQL for designing databases, understanding relationships between entities, and ensuring database structure clarity and efficiency.

Author|95 articles published


upGrad Learner Support
Talk to our experts. We are available 7 days a week, 10 AM to 7 PM
Indian Nationals
Foreign Nationals
Disclaimer
The above statistics depend on various factors and individual results may vary. Past performance is no guarantee of future results.
The student assumes full responsibility for all expenses associated with visas, travel, & related costs. upGrad does not .