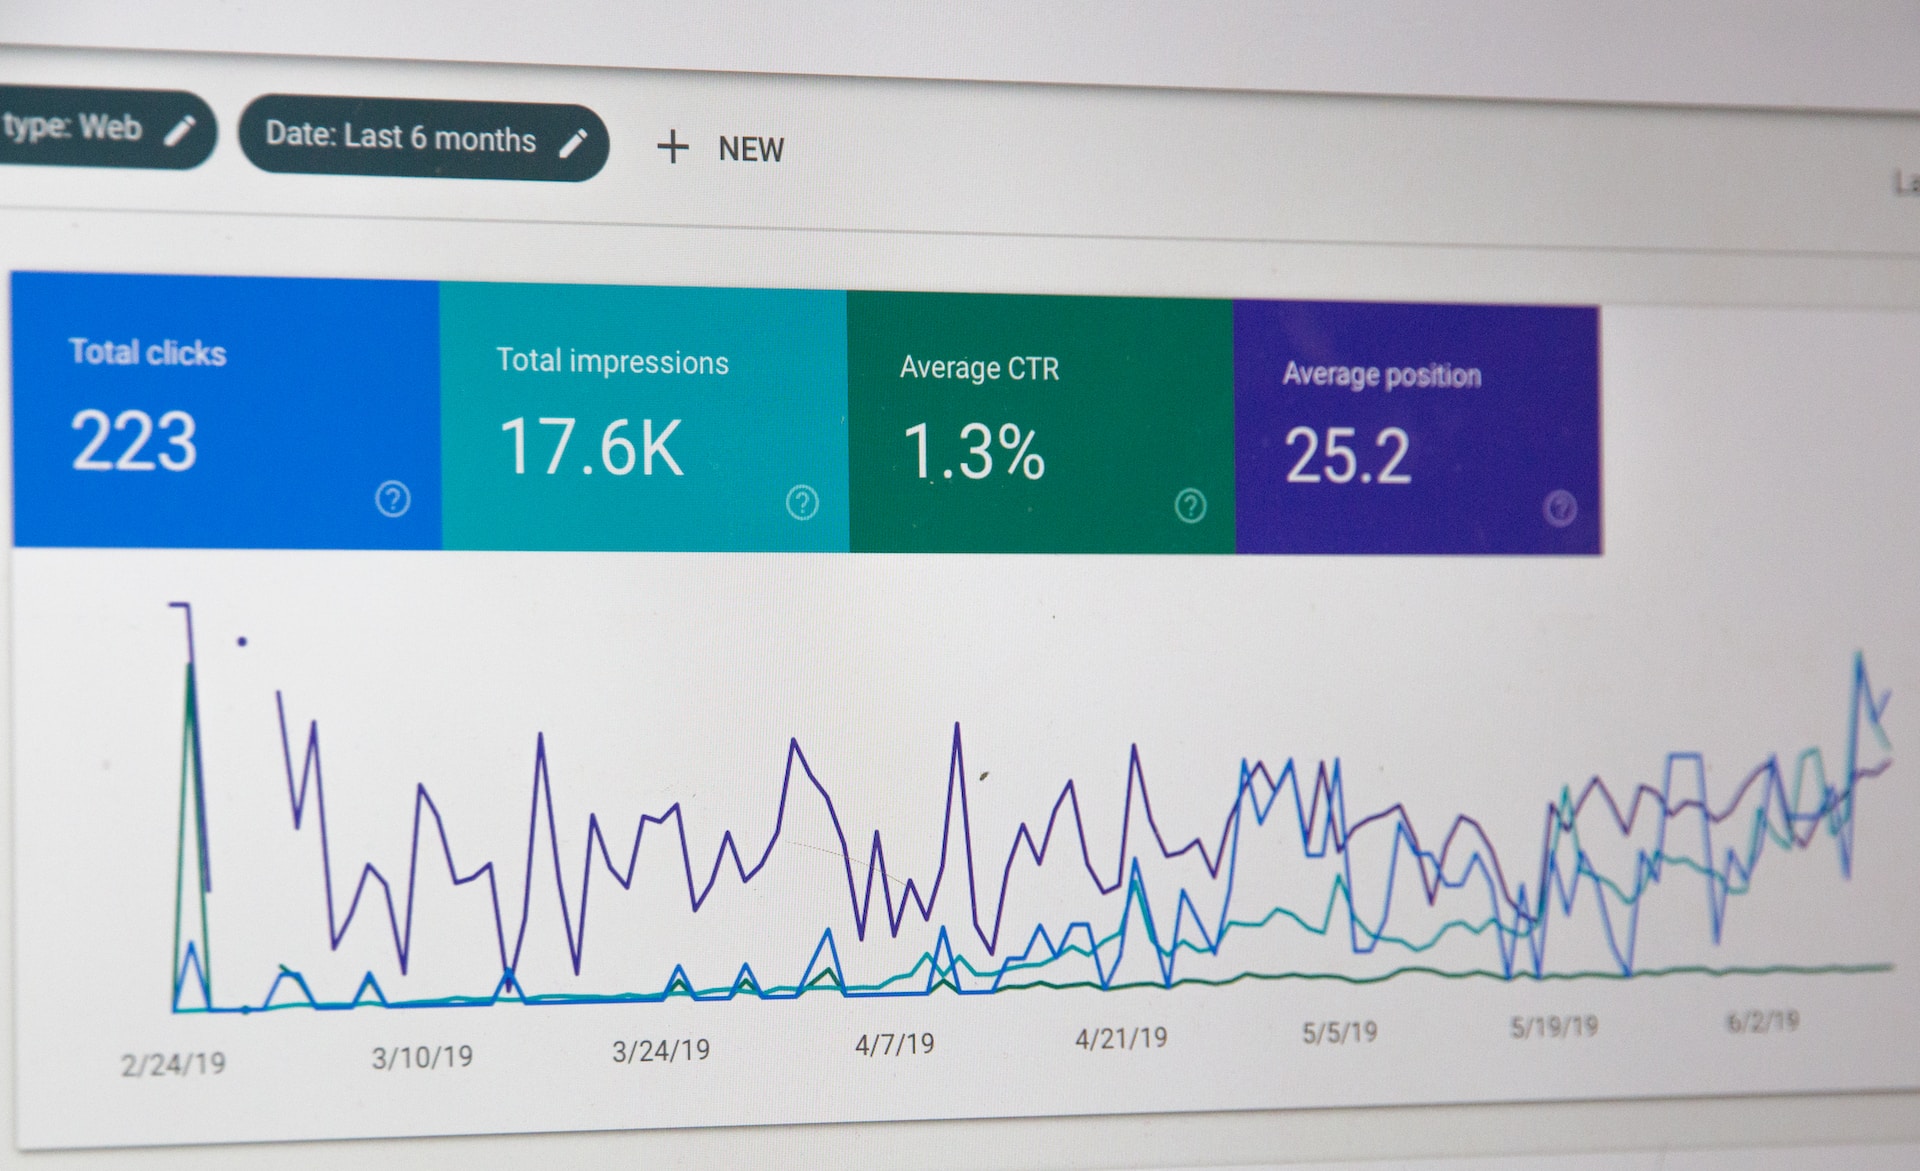
In the present age of data, it is crucial to comprehend the data to gain some useful insights. Furthermore, a crucial component of comprehending the deeper trends and strata in the data is data visualization!
The data visualization industry was expected to be worth $8.85 billion in 2019, says Fortune Business Insights. By the end of 2027, the data analysis market valuation is estimated to hit $19.2 billion. Moreover, this valuation is growing at a compound annualized growth rate of 10.2%.
Large data collections require daily analysis, interpretation, and visualization by data scientists. They should therefore have access to the appropriate data visualization tools.
In this article, you’ll come across the top four data visualization tools that every data scientist should be familiar with.
Tableau
It is a highly interactive and functional software for data presentation and visualization. Businesses leverage this technology for efficient data processing and data visualization. It has an interface that allows for drag-and-drop, which makes jobs easy and quick for it to do.
Users are not required to write programs by the software. Many different data sources are interoperable with the software. Although the instrument is somewhat pricey, a renowned corporation like Amazon favors it.
Learning to use this software often takes people two to six months. However, learning how to use all of Tableau’s features can take considerably longer.
Looker
Looker is among the best data analysis tools that can go in-depth into the data and analyze it to produce insightful results. Companies can now make quick decisions according to the data visualizations gathered, thanks to the live dashboards of the provided data.
You may connect to many databases without any problems thanks to Looker’s integrations with BigQuery, Snowflake, and Redshift, as well as more than 50 SQL dialects.
Microsoft Power BI

Microsoft Power BI is a powerful and robust tool businesses leverage for data visualization and business analysis. Whether it’s predictive analytics, self-service analytics, or reporting, businesses do rely on PowerBI for these operations.
As reported by Microsoft, more than 200,000 companies use this technology for their business intelligence requirements. It allows users to produce reports and distribute insights throughout their organization.
The ability to distribute reports developed through such interfaces inside the organization makes it a crucial tool for businesses looking for a consolidated data reporting solution.
QlikView
Another underrated data visualization tool that you must be familiar with is QlikView. It’s regarded as Tableau’s major rival and has over 50,000 users.
Due to QlikView’s ability to visualize both large and tiny amounts of data, many large corporations, including Paypal and Ford, use it to evaluate their data. Not only does the platform lets you download its free version (the one with limited features), but also the premium paid version.
Conclusion
Data is present everywhere. Therefore, businesses must be ready to decipher it and effectively convey their message. They can take advantage of greater prospects and land jobs in their ideal positions by acquiring data visualization technologies from a business-recognized online training platform.
FAQs
-
What is data visualization?
Data visualisation primarily aims to represent data in the form of visuals, like pictures or graphs. These representations make it simple for people to comprehend the analyzed trends visually.
-
What are data visualization tools?
Data visualization tools are state-of-the-art tools used for converting data into visual representations.
-
Do data scientists use data visualization?
Data professionals frequently use data visualization tools since doing so increases their productivity and improves how they present their findings.


